
The most common version of breakout trading goes like this: a stock hits a new high, volume spikes, it gets flagged on a scanner, traders pile in, and within two sessions it has either followed through or reversed and trapped everyone who chased.
That sequence is not a breakout strategy. It is a reaction to a breakout that has already happened.
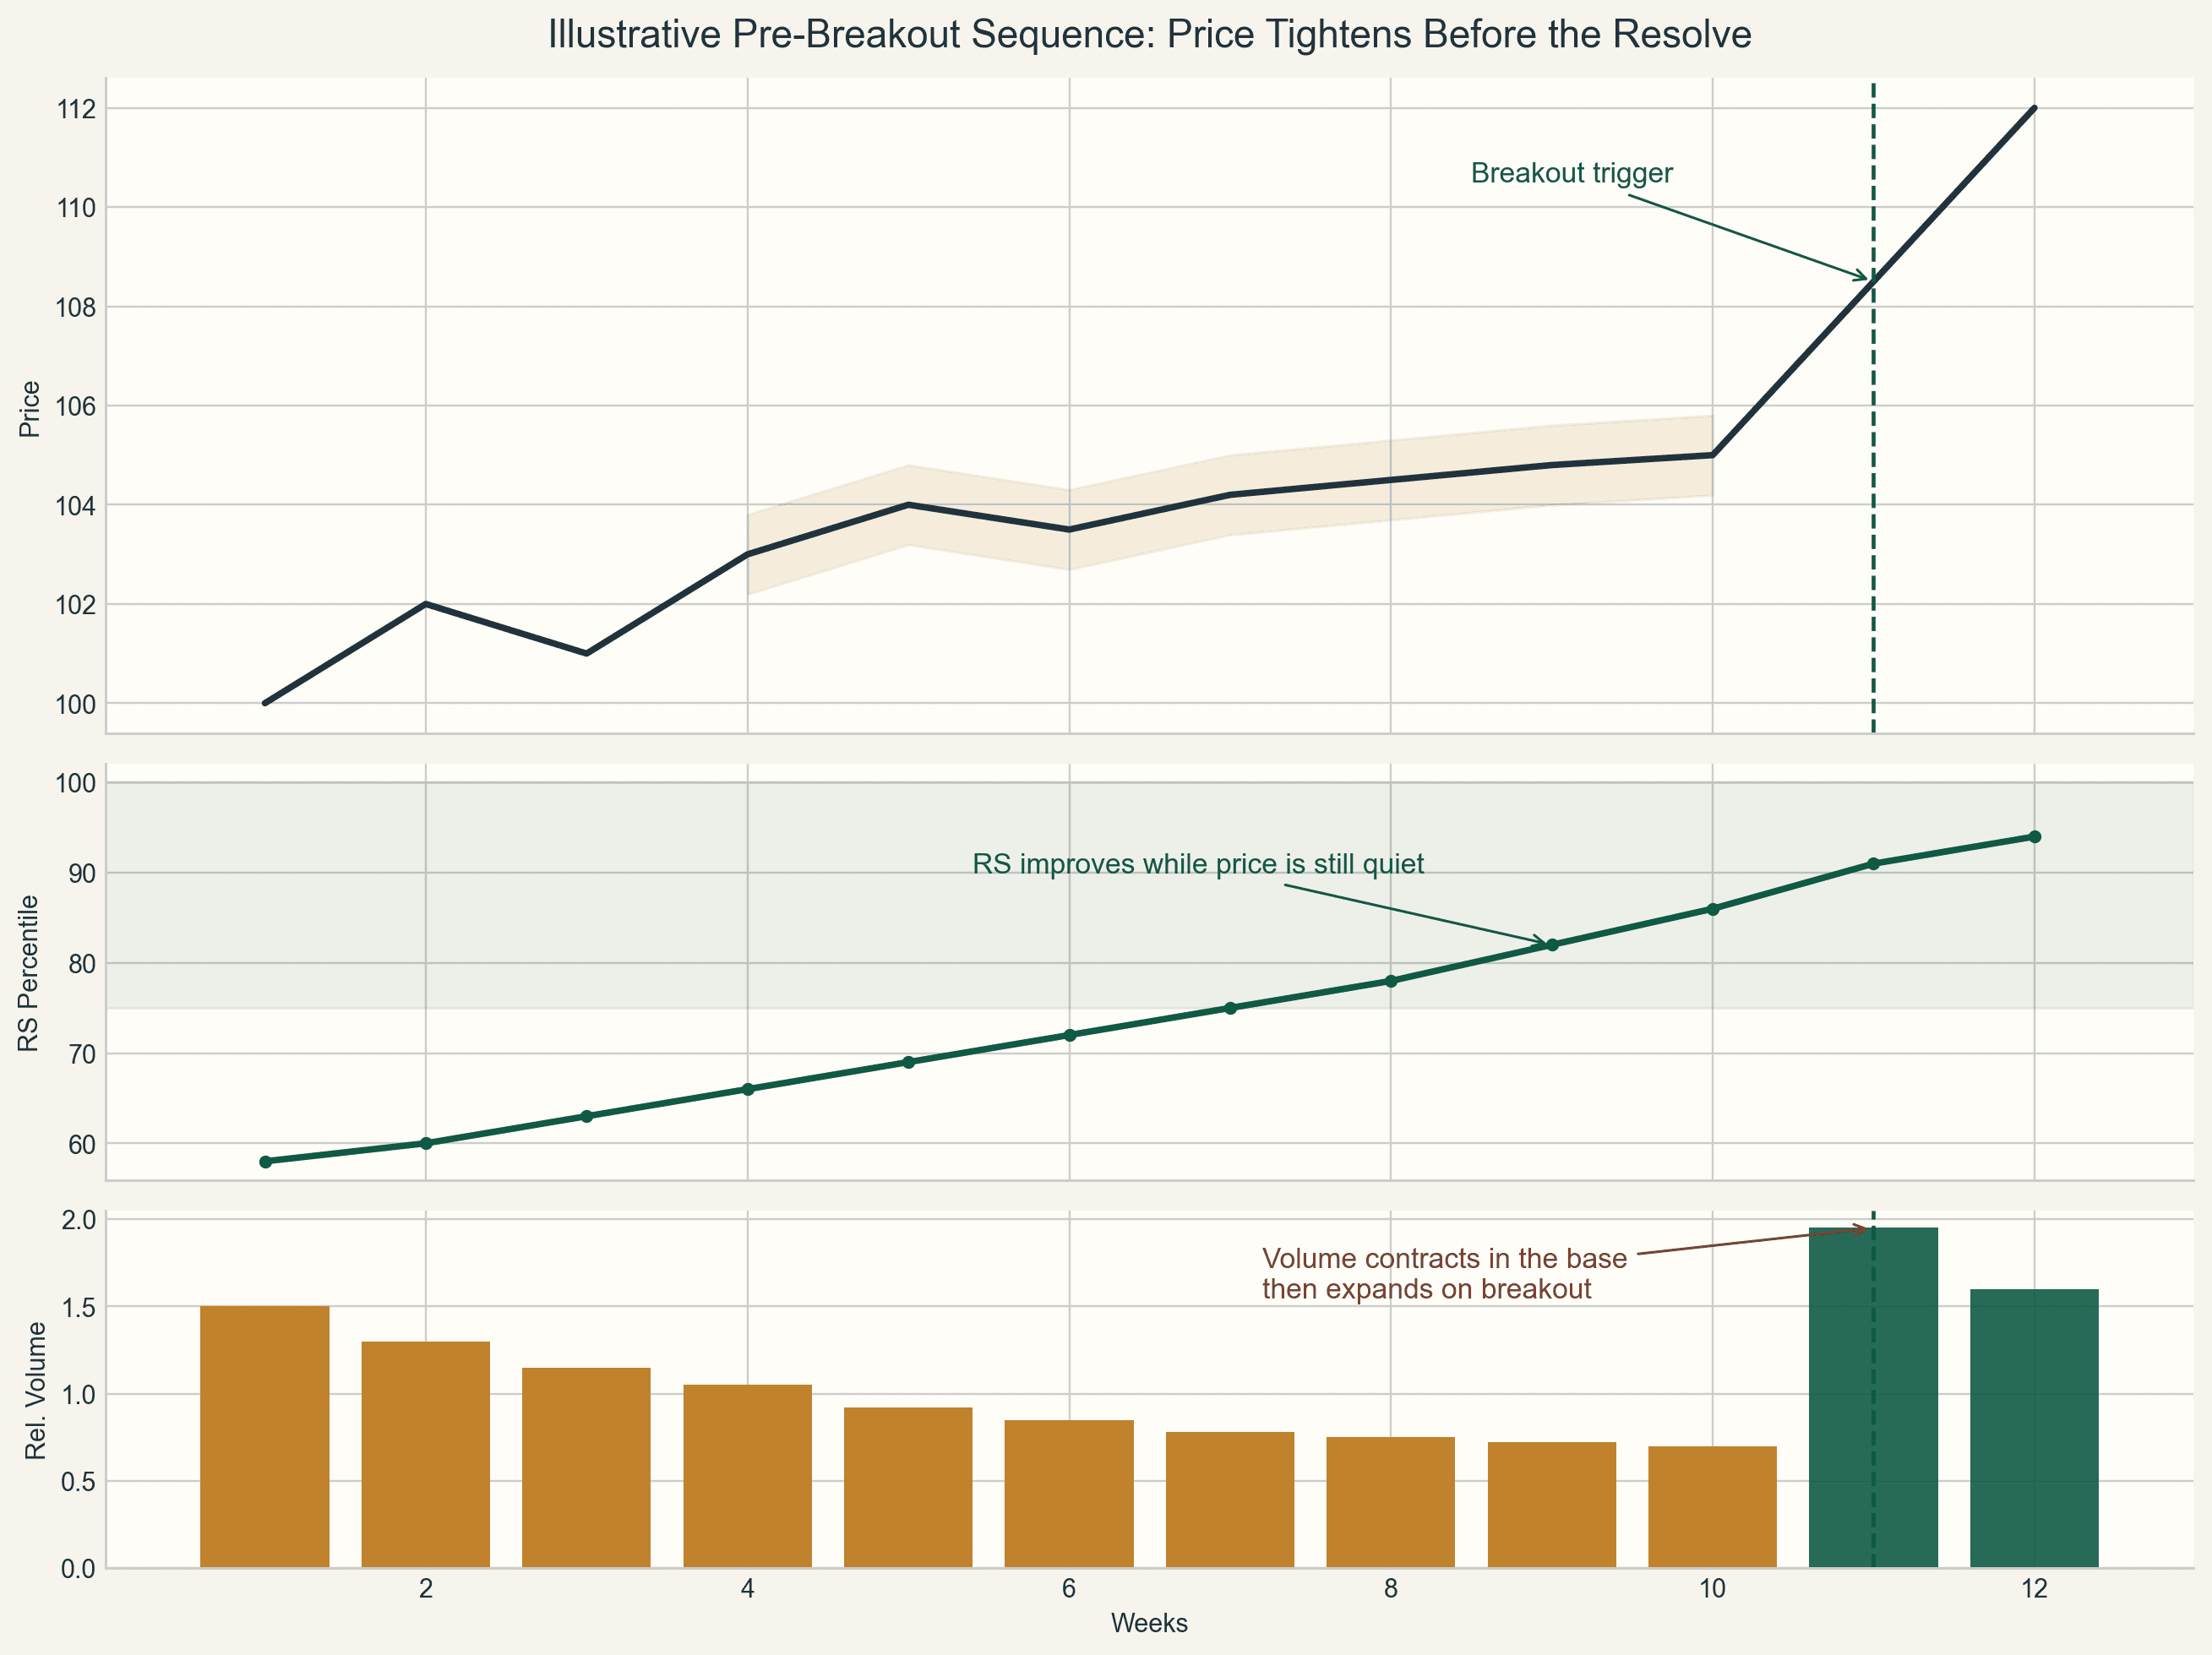
A relative strength breakout setup is a stock whose RS improves while price is still coiling, then resolves upward with volume.
The traders who consistently find relative strength breakout setups before they become crowded are not doing something exotic. They are reading a sequence of signals that shows up before the price move, a sequence that most traders never look for because they are watching price first and everything else second.
This article explains that sequence: why RS often improves before price breaks out, what volume behaviour tells you before and during a breakout, and how to combine these signals into a repeatable pre-breakout selection process.
The foundation for this article is the relative strength framework already covered in the TradInvest RS guide. If you have not read that, start there.
Why Most Traders Notice Breakouts Too Late
Price-based scanners are the default tool. Set them to flag stocks hitting 52-week highs, breaking above resistance, or crossing moving averages, and they generate a list. The problem is that every trader running the same scanner is looking at the same list at the same moment. By the time a breakout appears on a price scanner, the setup is already public.
In liquid, actively traded markets, including the mid-cap and large-cap names on NSE, the gap between a breakout appearing on a scanner and becoming crowded is often measured in minutes during market hours, and hours in pre-market preparation. Trying to build a systematic edge from price-based scan results alone means competing in the same narrow window as everyone else.
The more useful question is: what signals show up before the price breakout?
The answer, consistently, is relative strength improvement and volume contraction, two behaviours that precede most high-quality breakouts and that are almost invisible to traders who are only watching price.
Why Relative Strength Improves Before Price Becomes Obvious
When larger buyers begin accumulating a position in a stock, the accumulation usually does not happen in one session. It happens over weeks. The result is that the stock starts holding up better than the market during down days and recovering faster than peers during up days.
Price action may still look unremarkable. The stock can remain inside a range, below a key resistance level, and still not print new highs. But relative to the rest of the universe, it is already quietly outperforming.
That quiet outperformance is RS improvement. And it often shows up in the data before the price chart signals anything to a scanner.
This is why tracking RS percentile rank week over week, not just at a single point in time, is one of the most useful early indicators of a stock building toward a breakout. A stock climbing from the 62nd to the 71st to the 79th percentile of its universe across three consecutive weekly RS reads is telling you something. Demand is building. The relative-performance trend is improving before the price move becomes obvious.
For a detailed breakdown of how to build this kind of multi-week RS tracking, see the RS ranking system article.
Why Volume Is the Confirmation Layer
RS improvement tells you that a stock is gaining relative demand. It does not tell you whether that demand is sustainable or whether the price structure is ready to resolve.
Volume fills that gap. Two volume behaviours matter in the context of pre-breakout analysis.
Volume contraction during the base. A stock building a proper consolidation before a breakout should show declining volume as price tightens. This suggests sellers have largely been absorbed and there is less urgent supply pressing against the stock.
If volume remains elevated or erratic during a consolidation, there is usually still active selling or uncertainty about direction. That kind of consolidation tends to resolve with less conviction or fail outright.
Volume expansion on the breakout. When a stock finally breaks above its consolidation range or a prior resistance level, volume should expand meaningfully, ideally above the 20-session average volume and ideally on the highest-volume session seen in several weeks. This confirms that new buyers are stepping in at the breakout level rather than the move being driven by a thin burst of momentum chasing.
A breakout on below-average volume is a warning sign. The price is moving, but the participation may not be broad enough to sustain it.
The combination of RS improvement, base-level volume contraction, and volume expansion on the breakout is the three-part confirmation sequence that separates high-quality setups from noise.
The CVR Framework: Coil, Validate, Resolve
Rather than evaluating these signals independently, a structured pre-breakout workflow reads them in sequence. The CVR framework, Coil, Validate, Resolve, provides that sequence.
C: Coil (Price structure + volume contraction)
The first condition is that the stock is in a recognisable consolidation structure: a flat base, a tight range, a bull flag, or a narrow volatility contraction. The price range should be compressing, not expanding. Volume during this phase should be declining relative to the weeks before the consolidation began.
A stock that is coiling is absorbing supply without giving up ground. Not every tight base resolves upward, but very few high-quality breakouts happen without one.
V: Validate (RS improvement during the coil)
The second condition is that while the stock is coiling and looking quiet on price, its RS rank is improving. This is the validation step. It answers the question: is the quiet price action the result of accumulation, or is the stock just drifting?
A stock that is coiling in price while climbing the RS percentile ranks is far more interesting than a stock whose price looks similar but whose RS is flat or fading. Those two setups can look identical on a chart. RS separates them.
For context on which RS timeframe to use during this validation step, the multi-timeframe RS article is the relevant reference. For pre-breakout timing, the 3-month RS trend is often the most sensitive signal. The 6-month RS provides durability confirmation.
R: Resolve (Breakout with volume expansion)
The third condition is the actual breakout: a clean move above the consolidation range or prior resistance on expanding volume. This is not a prediction. It is a trigger. You do not enter simply because the stock is coiling and validating well. The resolve is what turns a candidate into a trade.
When the resolve arrives with volume confirmation, you act. When it arrives on weak volume, you either pass or take a smaller initial position with a very defined stop.
The CVR framework is not a mechanical system. It is a sequencing discipline. It keeps you from acting on partial signals and from missing setups that the data flagged early.
Worked Example: Mid-Cap Capital Goods Stock on NSE
Consider a hypothetical mid-cap stock in the capital goods sector on NSE during a period of broad sector rotation into industrials.
Phase 1: The Coil
The stock has been in a range for seven weeks. Price sits roughly 8 to 10 percent below the range high, not making new highs, not selling off sharply. Weekly candles are getting progressively narrower. Volume during weeks four through seven of the consolidation is running at roughly 40 to 50 percent of its average volume from the prior trending phase. The stock looks quiet on a price scanner and generates no obvious alerts.
Phase 2: The Validate
While price is coiling, the RS data tells a different story. Six weeks into the consolidation, the stock's 3-month RS percentile rank has moved from the 64th to the 72nd to the 81st percentile on three consecutive weekly reads. The 6-month RS is also improving, moving from the 58th to the 67th percentile. The stock is gaining on the Nifty 500 universe in relative terms while price still looks subdued.
Additionally, the sector it belongs to, capital goods, is itself showing RS improvement at the sector level, moving from mid-table to top-quartile on 6-month RS. Two layers of RS validation are in place.
At this point, the CVR framework is at C complete and V complete. A serious trader has this stock near the top of the watchlist with a specific price level marked as the breakout trigger.
Phase 3: The Resolve
In week eight, the stock breaks above the top of its consolidation range. Volume on the breakout week is the highest in eleven weeks, nearly double the average volume of the preceding consolidation phase. The price closes near the high of the weekly range.
The breakout is not yet obvious to everyone. It takes one more session for it to appear on many high-based screens because it has not yet cleared a prior absolute high. By the time broader scanners flag it, the stock is already several percent above the entry point that the CVR workflow identified earlier.
What this illustrates is simple: the edge was not in reacting to the breakout. It was in reading the sequence, consolidating price, contracting volume, rising RS across two timeframes, and confirming sector context, before the resolve made the setup visible to everyone else.
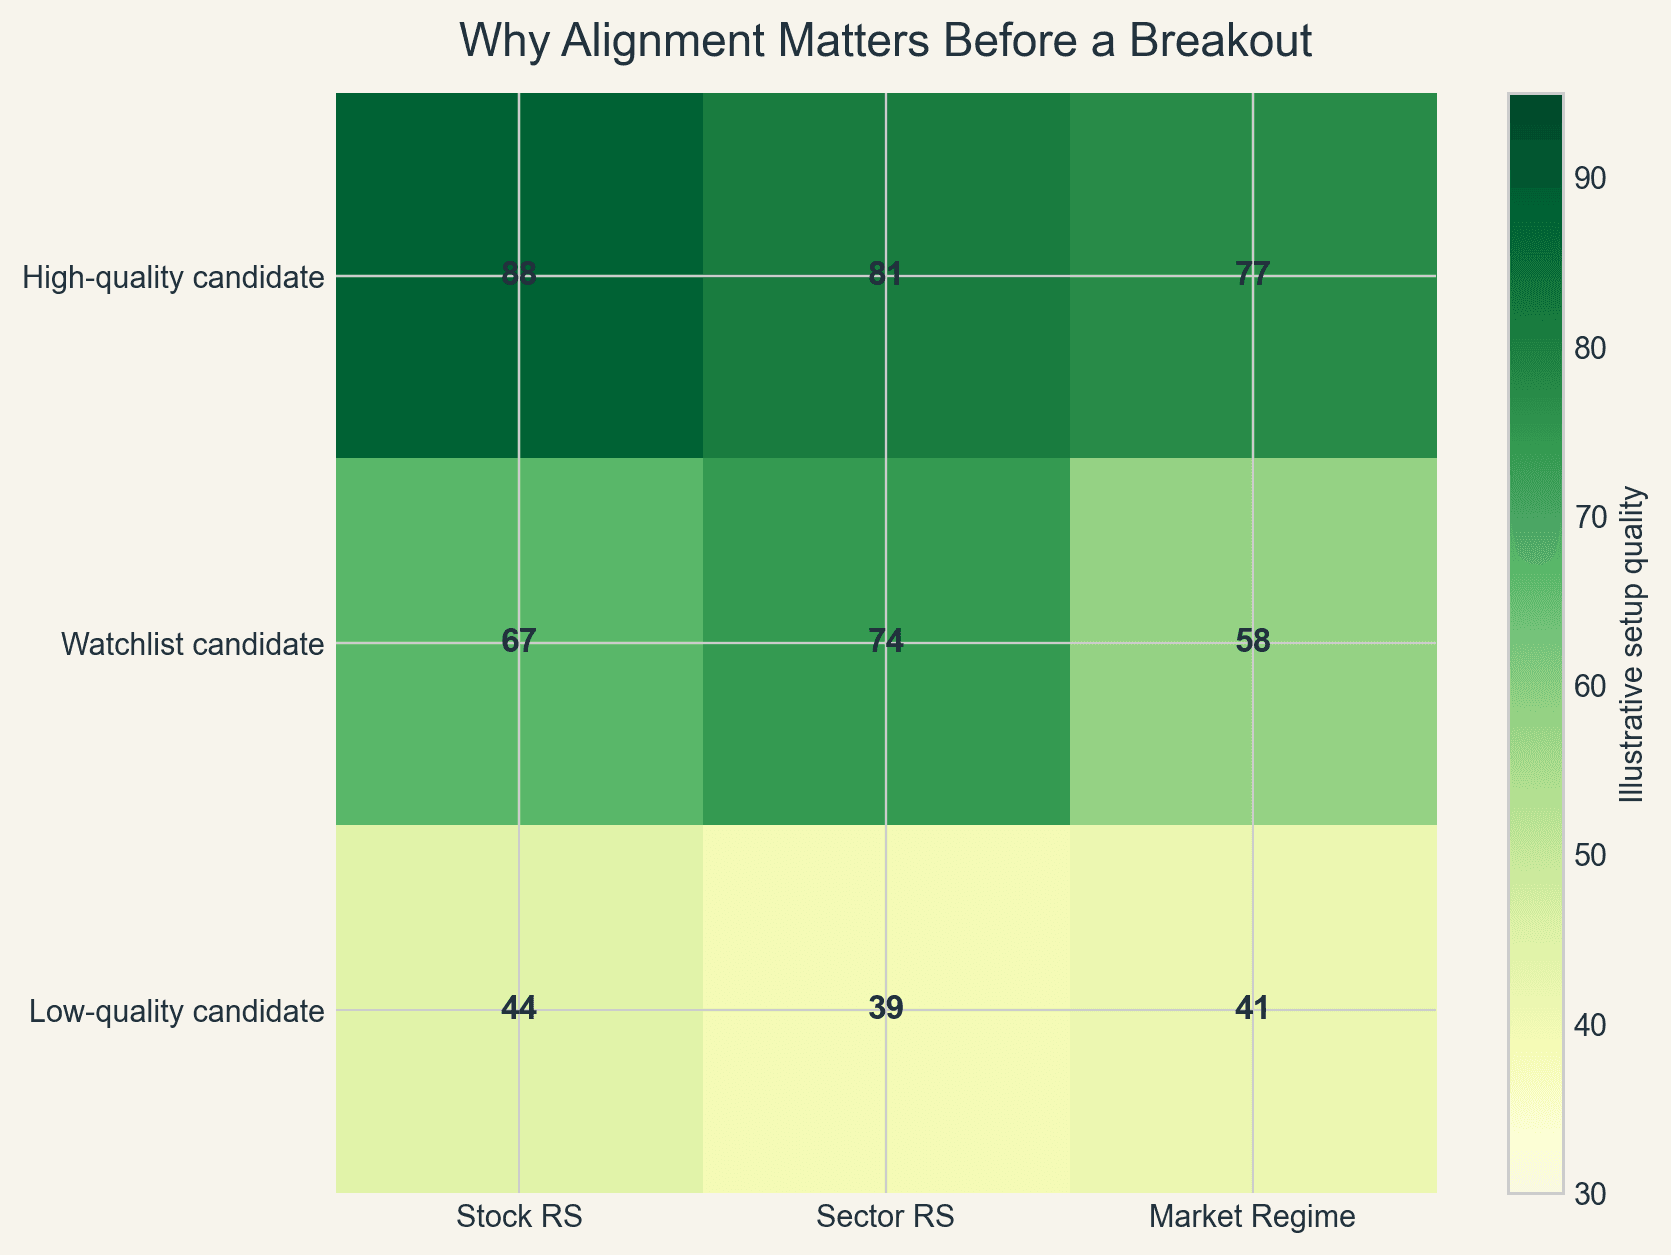
Combining Stock RS, Sector RS, and Market Regime
A pre-breakout setup does not exist in isolation. Its probability of following through depends meaningfully on the broader context around it. Three layers of context matter.
Stock RS: The individual stock must be showing RS improvement during its consolidation phase. This is non-negotiable in the CVR framework.
Sector RS: A breakout from a stock inside a sector that is itself gaining RS is structurally stronger than a breakout from an isolated name in a lagging sector. Sector tailwinds increase follow-through probability because the flows driving sector performance tend to lift multiple names, not just one. For a practical guide to reading sector RS, see the sector rotation article.
Market regime: Breakout setups in Indian mid-caps behave very differently depending on whether the broader market is trending or choppy. In a healthy uptrend, breakouts from strong RS bases tend to follow through with multi-week momentum. In a range-bound market, even good-looking setups fail more often because there is no broader tailwind behind them. The market regime framework is the context layer that helps decide how aggressively to act.
The most reliable breakout setups are those where all three layers align: the stock RS is improving during the coil, the sector RS confirms the theme, and the broader market regime supports trend-following behaviour.
For Indian Traders: Specific Considerations
Event-driven spikes can mimic RS improvement. In Indian markets, earnings season, budget announcements, and RBI policy decisions can produce sharp short-term RS jumps that have nothing to do with sustained accumulation. A stock that surges from the 55th to the 90th RS percentile in a single week after a strong quarterly result is not showing the same kind of gradual RS improvement that precedes a structural breakout. Real pre-breakout RS improvement is usually gradual and multi-week.
Mid-cap breakouts in India can be sharp but require sector support. NSE mid-cap names can produce fast-moving breakouts, but the ones with the best follow-through usually have sector-level support behind them. Requiring sector RS confirmation before acting on a mid-cap breakout setup is a meaningful quality filter.
Liquidity matters for volume analysis. Volume contraction and expansion signals are most reliable in stocks with consistent daily trading volume. In thinly traded small-caps, volume can be erratic regardless of setup quality, making the CVR framework harder to apply cleanly.
Base quality matters. Long, deep, choppy bases formed after heavy damage tend to produce weaker breakouts than short, tight consolidations inside ongoing uptrends. The second type is what the CVR framework is designed to find.
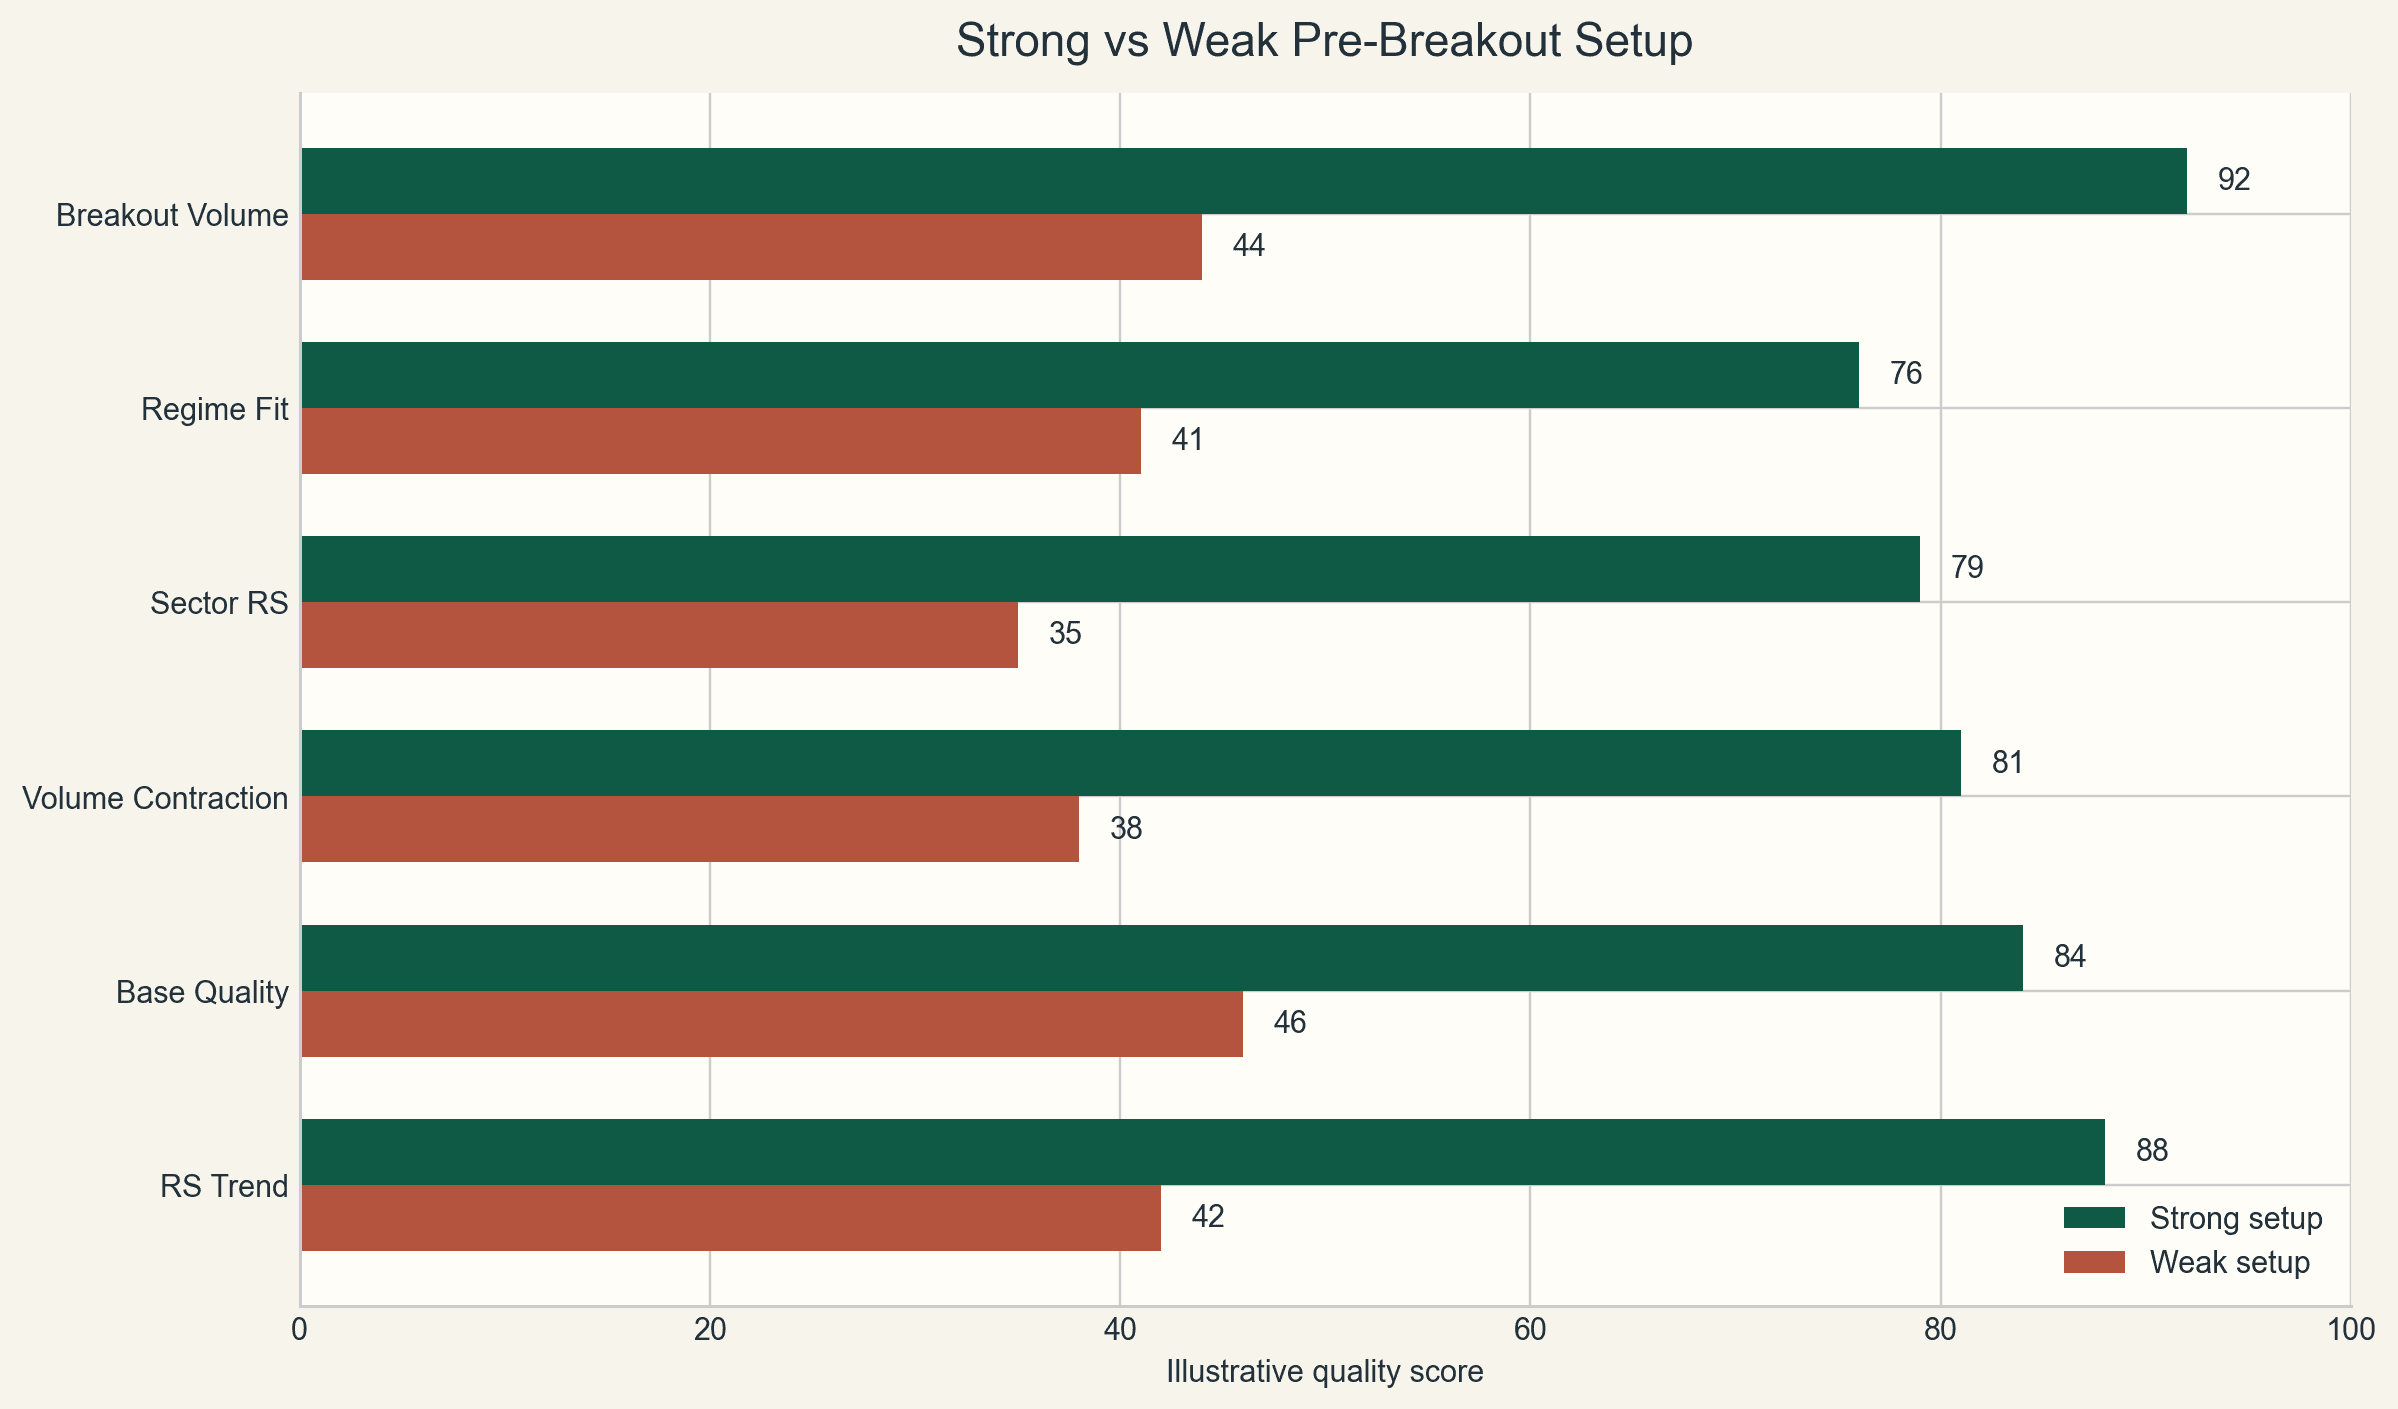
Side-by-Side: Strong Pre-Breakout Setup vs Weak Pre-Breakout Setup
| Signal | Strong Setup | Weak Setup |
|---|---|---|
| RS trend during base | Rising consistently over 3 to 6 weeks | Flat or declining during consolidation |
| Volume during base | Contracting, well below average | Elevated, erratic, or mixed |
| Price range during base | Tightening, range compressing | Wide swings, failed breakout attempts |
| Sector RS context | Sector gaining RS simultaneously | Sector flat or losing RS |
| Market regime | Broad market in uptrend | Choppy or range-bound market |
| Volume on breakout | Expands sharply, above 20-day average | Below average or barely average |
| RS on breakout day | Near or at highest RS percentile in base | No clear RS acceleration |
Common Mistakes
Entering on RS improvement alone, without the base. A stock climbing the RS ranks while still in a downtrend, or while making lower highs, is not a pre-breakout candidate. RS improvement matters only when it occurs alongside a constructive price structure.
Ignoring volume during the consolidation phase. Most traders check volume on the breakout day and nowhere else. Volume behaviour during the base is equally important.
Acting before the resolve. The CVR framework identifies candidates, not entries. The resolve, the actual breakout with volume, is the trigger.
Treating every tight base as a pre-breakout setup. Stocks consolidate for many reasons, including quiet distribution and simple neglect. Without the RS validation step, a tight base is just a tight base.
Overweighting stock-level signals when sector and regime are unfavourable. Even the cleanest CVR setup has a lower probability of following through when the sector is losing RS or the broader market is choppy. Context is not optional. It is the risk filter.
Key Takeaway
Finding strong stocks before they break out is not about better scanners. It is about reading a sequence of signals that shows up before price becomes obvious.
That sequence, under the CVR framework, is: a stock coiling in a tight consolidation with contracting volume, showing rising RS percentile rank across multiple weekly reads while price is still range-bound, and then breaking out with expanding volume that confirms new demand.
When this sequence aligns with a sector that is also gaining RS, and a market regime that supports trend-following behaviour, the setup has multiple layers of confirmation behind it and you are positioned before it appears on the most obvious scanners.
If you want to continue the RS workflow, the next useful reads are the foundational guide, the ranking article, the timeframe comparison, and the sector rotation article. If you want to see how this connects to the product side, review TradInvest features, TradInvest Edge, or the current pricing page.
Spread the good words
Give your view.
Give your view
Comments
0Use this insight inside the product
TradInvest is built to connect market context, strategy quality, and post-trade learning. Read the market with Pulse, narrow your watchlist with rotation and momentum, then review what actually worked.
Related posts
More insight tied to the same trading workflow.


