
Every trader who has spent time learning technical analysis eventually hits the same wall.
The patterns look right. The setup checks out. The entry is clean. And then the trade fails in a way the chart did not seem to warn about. Not because the analysis was wrong, exactly, but because something outside the chart was working against it.
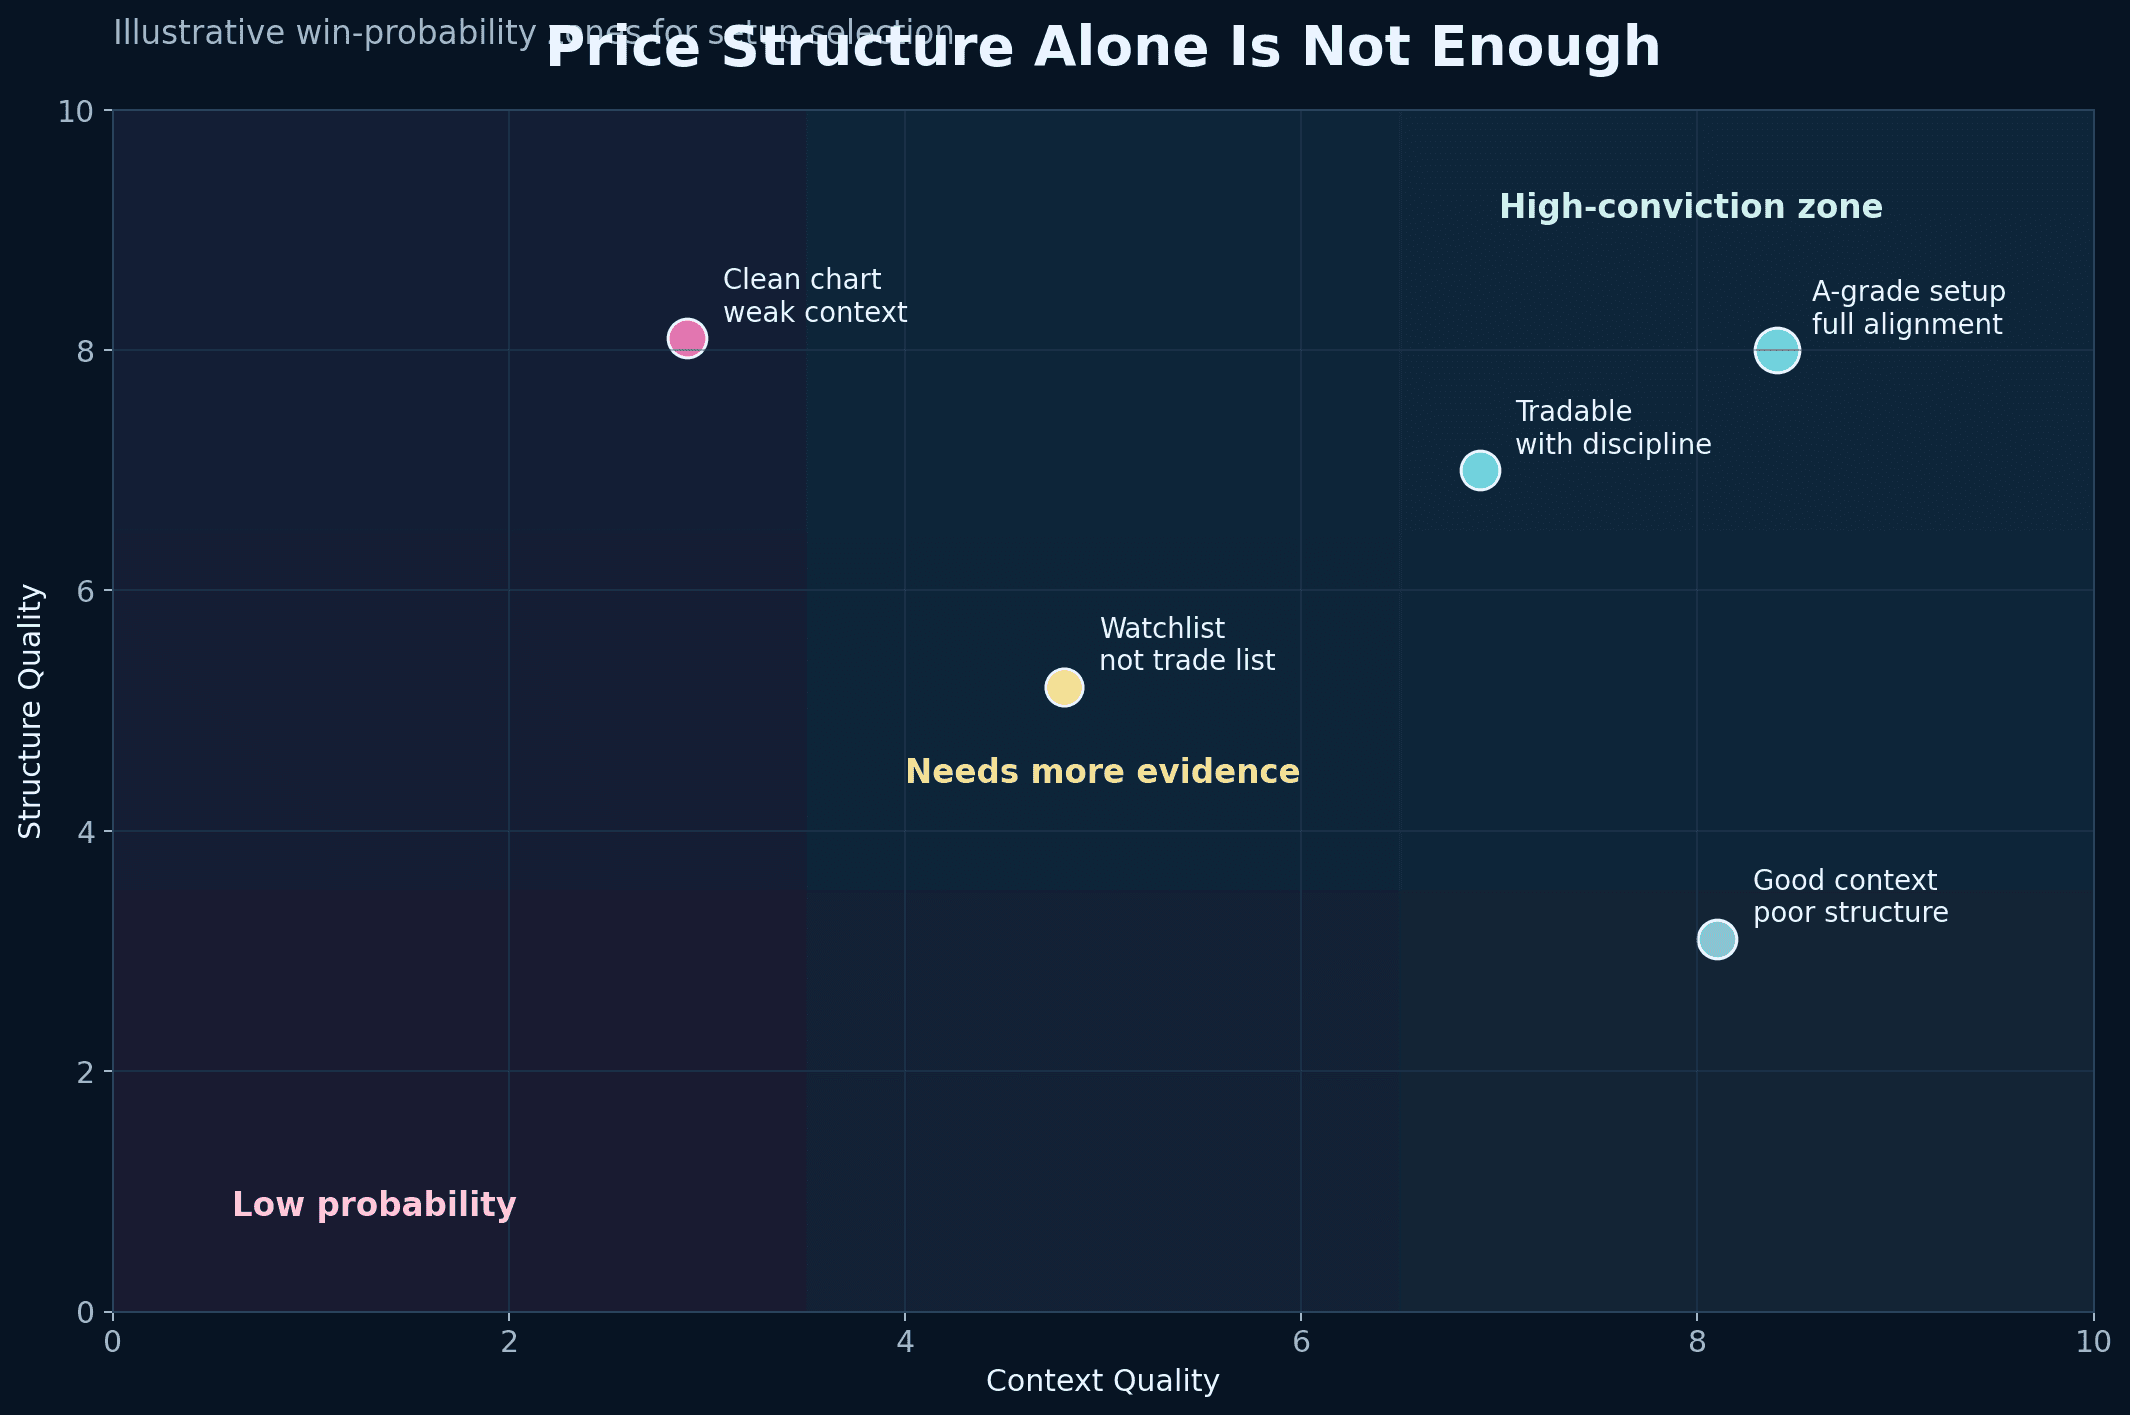
Price structure trading is a legitimate skill. But it is an incomplete one when used without market context. The same chart setup that produces a clean trending move in one environment produces a failed breakout and a quick reversal in another. The chart looks identical. The outcome is different. The variable is context.
This article is about building the habit of reading both together -- structure and context -- so that the trades you take are not just technically valid but situationally appropriate.
If you are not yet reading market regime as part of your trade selection process, the market regime article is the right foundation to read alongside this one.
Why Clean Charts Still Produce Bad Trades
Most technical education focuses on what a pattern looks like. Bull flag. Cup and handle. Inside bar. Volatility contraction. These formations are real, they have statistical basis, and recognising them is a useful skill.
The problem is that every retail trader with a charting platform can see the same patterns at the same time. Pattern recognition is not an edge by itself. What matters is whether the conditions surrounding the pattern make it likely to resolve as expected.
A bull flag in a stock that is in a deteriorating sector, during a choppy market regime, with declining relative strength is a very different trade from a bull flag in a sector leader with expanding relative strength in a healthy trending market. The pattern is identical. The probability of follow-through is not.
Traders who trade patterns without context are working with one half of the information required. They get enough right trades to believe the method works, and enough failed trades to wonder why it does not work consistently. The inconsistency is almost always a context problem, not a pattern problem.
What Price Structure Actually Tells You
Price structure is the language of supply and demand in a specific stock over a specific period. It tells you where buyers and sellers have previously established positions, where supply has been absorbed, where demand has been tested, and how the balance between the two has shifted over time.
A tight consolidation after a strong trending move tells you supply is being absorbed -- sellers who want to exit are finding buyers willing to take the stock. A series of higher lows tells you buyers are becoming more aggressive, not waiting for a better price. A range with multiple failed breakout attempts tells you there is overhead supply that has not yet been cleared.
These observations are useful. They tell you about the internal dynamics of a single stock. What they do not tell you is whether the broader forces that would drive that stock to the next level -- sector flows, market regime, institutional interest -- are present or absent.
Price structure answers: is this stock positioned to move?
Market context answers: is the environment likely to allow it?
You need both answers before taking a position.
What Market Context Adds
Market context is everything outside the individual chart that affects whether a setup resolves as expected.
It has four layers, each of which narrows the field of trades worth taking.
Regime. Is the broader market in a trending phase, a range-bound phase, or a deteriorating phase? Trend-following setups -- breakouts, continuation patterns, momentum entries -- work best in trending regimes. In choppy or range-bound regimes, these setups fail at higher rates because there is no macro tailwind lifting them. Identifying regime before selecting setups is not optional analysis -- it is the first filter.
Sector alignment. Is the stock in a sector that is currently attracting institutional capital, or in a sector that is losing it? A technically clean setup in a lagging sector has a structurally lower probability of producing a sustained move. Capital flows at the sector level shape individual stock outcomes more than most traders account for. The sector rotation framework covers how to read this.
Relative strength. Is the stock outperforming its benchmark during the period leading up to the setup? Rising relative strength during a consolidation is evidence that institutional demand is present, even when price is not making obvious moves. Flat or declining RS during a consolidation suggests the stock is drifting, not accumulating. For a detailed breakdown of how RS reads in the context of pre-breakout setups, the breakout selection article covers this specifically.
Execution risk. Are there near-term events -- earnings, index rebalancing, expiry sessions, macro announcements -- that create volatility unrelated to the setup? Clean structure with high event risk is a setup worth watching, not necessarily one worth entering before the event.
When all four layers of context align with a valid price structure, the setup has multiple forces behind it. When they diverge, the structure alone is not enough justification.
The SLRA Framework: Four Questions Before Any Trade
Rather than evaluating structure and context separately and then trying to reconcile them, a cleaner approach runs them through a single four-question framework before any trade is taken.
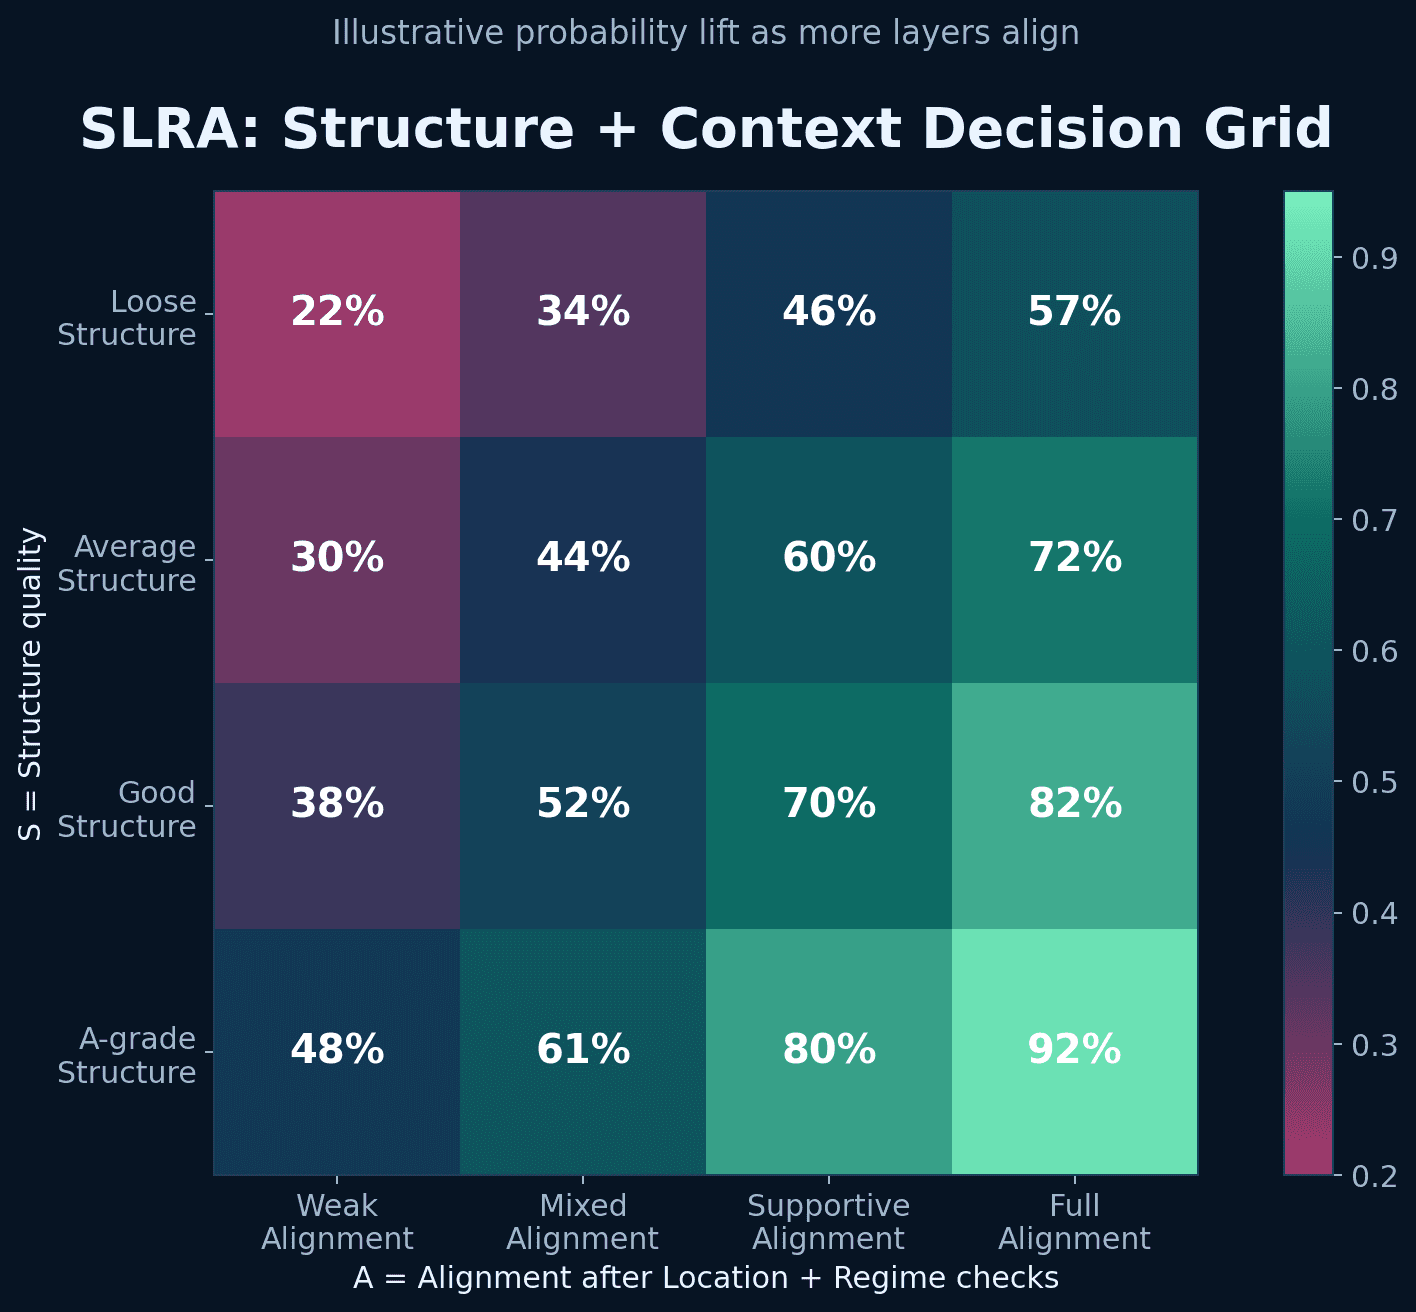
The SLRA framework -- Structure, Location, Regime, Alignment -- asks one focused question at each stage. A setup needs to clear all four to be worth acting on.
S -- Structure (Is the price setup technically valid?)
The first question is structural quality. Is the consolidation tight or loose? Is the base building on rising volume support or showing erratic, high-volume chop? Is the pattern well-formed with clear boundaries, or is it ambiguous enough that different traders would read it differently?
Structure quality is not binary -- it exists on a spectrum. An A-grade structure has clear boundaries, controlled volume behaviour during the base, and a well-defined entry trigger. A B-grade structure is messier, requires more interpretation, and has a lower probability of clean resolution. Knowing which you are looking at matters for sizing if nothing else.
L -- Location (Is the setup occurring at a meaningful price level?)
A valid structure at a bad location is a lower-quality trade. A breakout from a tight base that is occurring mid-range, with significant resistance directly overhead, is a structurally sound setup in a poor location. It may work, but it is fighting supply that a better-located setup does not have.
Good location means the setup is occurring near a level that has historical significance -- a prior base, a major swing high or low that has now been cleared, a well-defined support zone -- and that there is sufficient room to the next meaningful resistance level for the trade to develop before being challenged.
R -- Regime (Is the broader market environment supportive?)
The regime question asks whether the macro context is working with the setup or against it. A breakout attempt in a market that is in a range-bound or deteriorating regime faces structural headwinds. The index-led mood shifts that characterise Indian markets -- where broader Nifty weakness can suppress even the strongest individual setups on difficult days -- make this question particularly important.
If the regime is not supportive, the setup moves to the watch list, not the trade list. The same setup in a trending regime becomes significantly more actionable.
A -- Alignment (Do sector RS and stock RS confirm the setup?)
The final question checks whether the context layers outside the chart are pointing in the same direction as the structure. Is the sector gaining RS? Is the stock itself showing improving RS during the consolidation? Is the stock in the top quartile of its universe by composite RS score?
When structure, location, regime, and alignment all point in the same direction, the setup has been verified across every layer of analysis. When one layer is missing, the trade is lower conviction and should be sized accordingly or passed entirely.
Worked Example: The Same Setup in Two Different Contexts
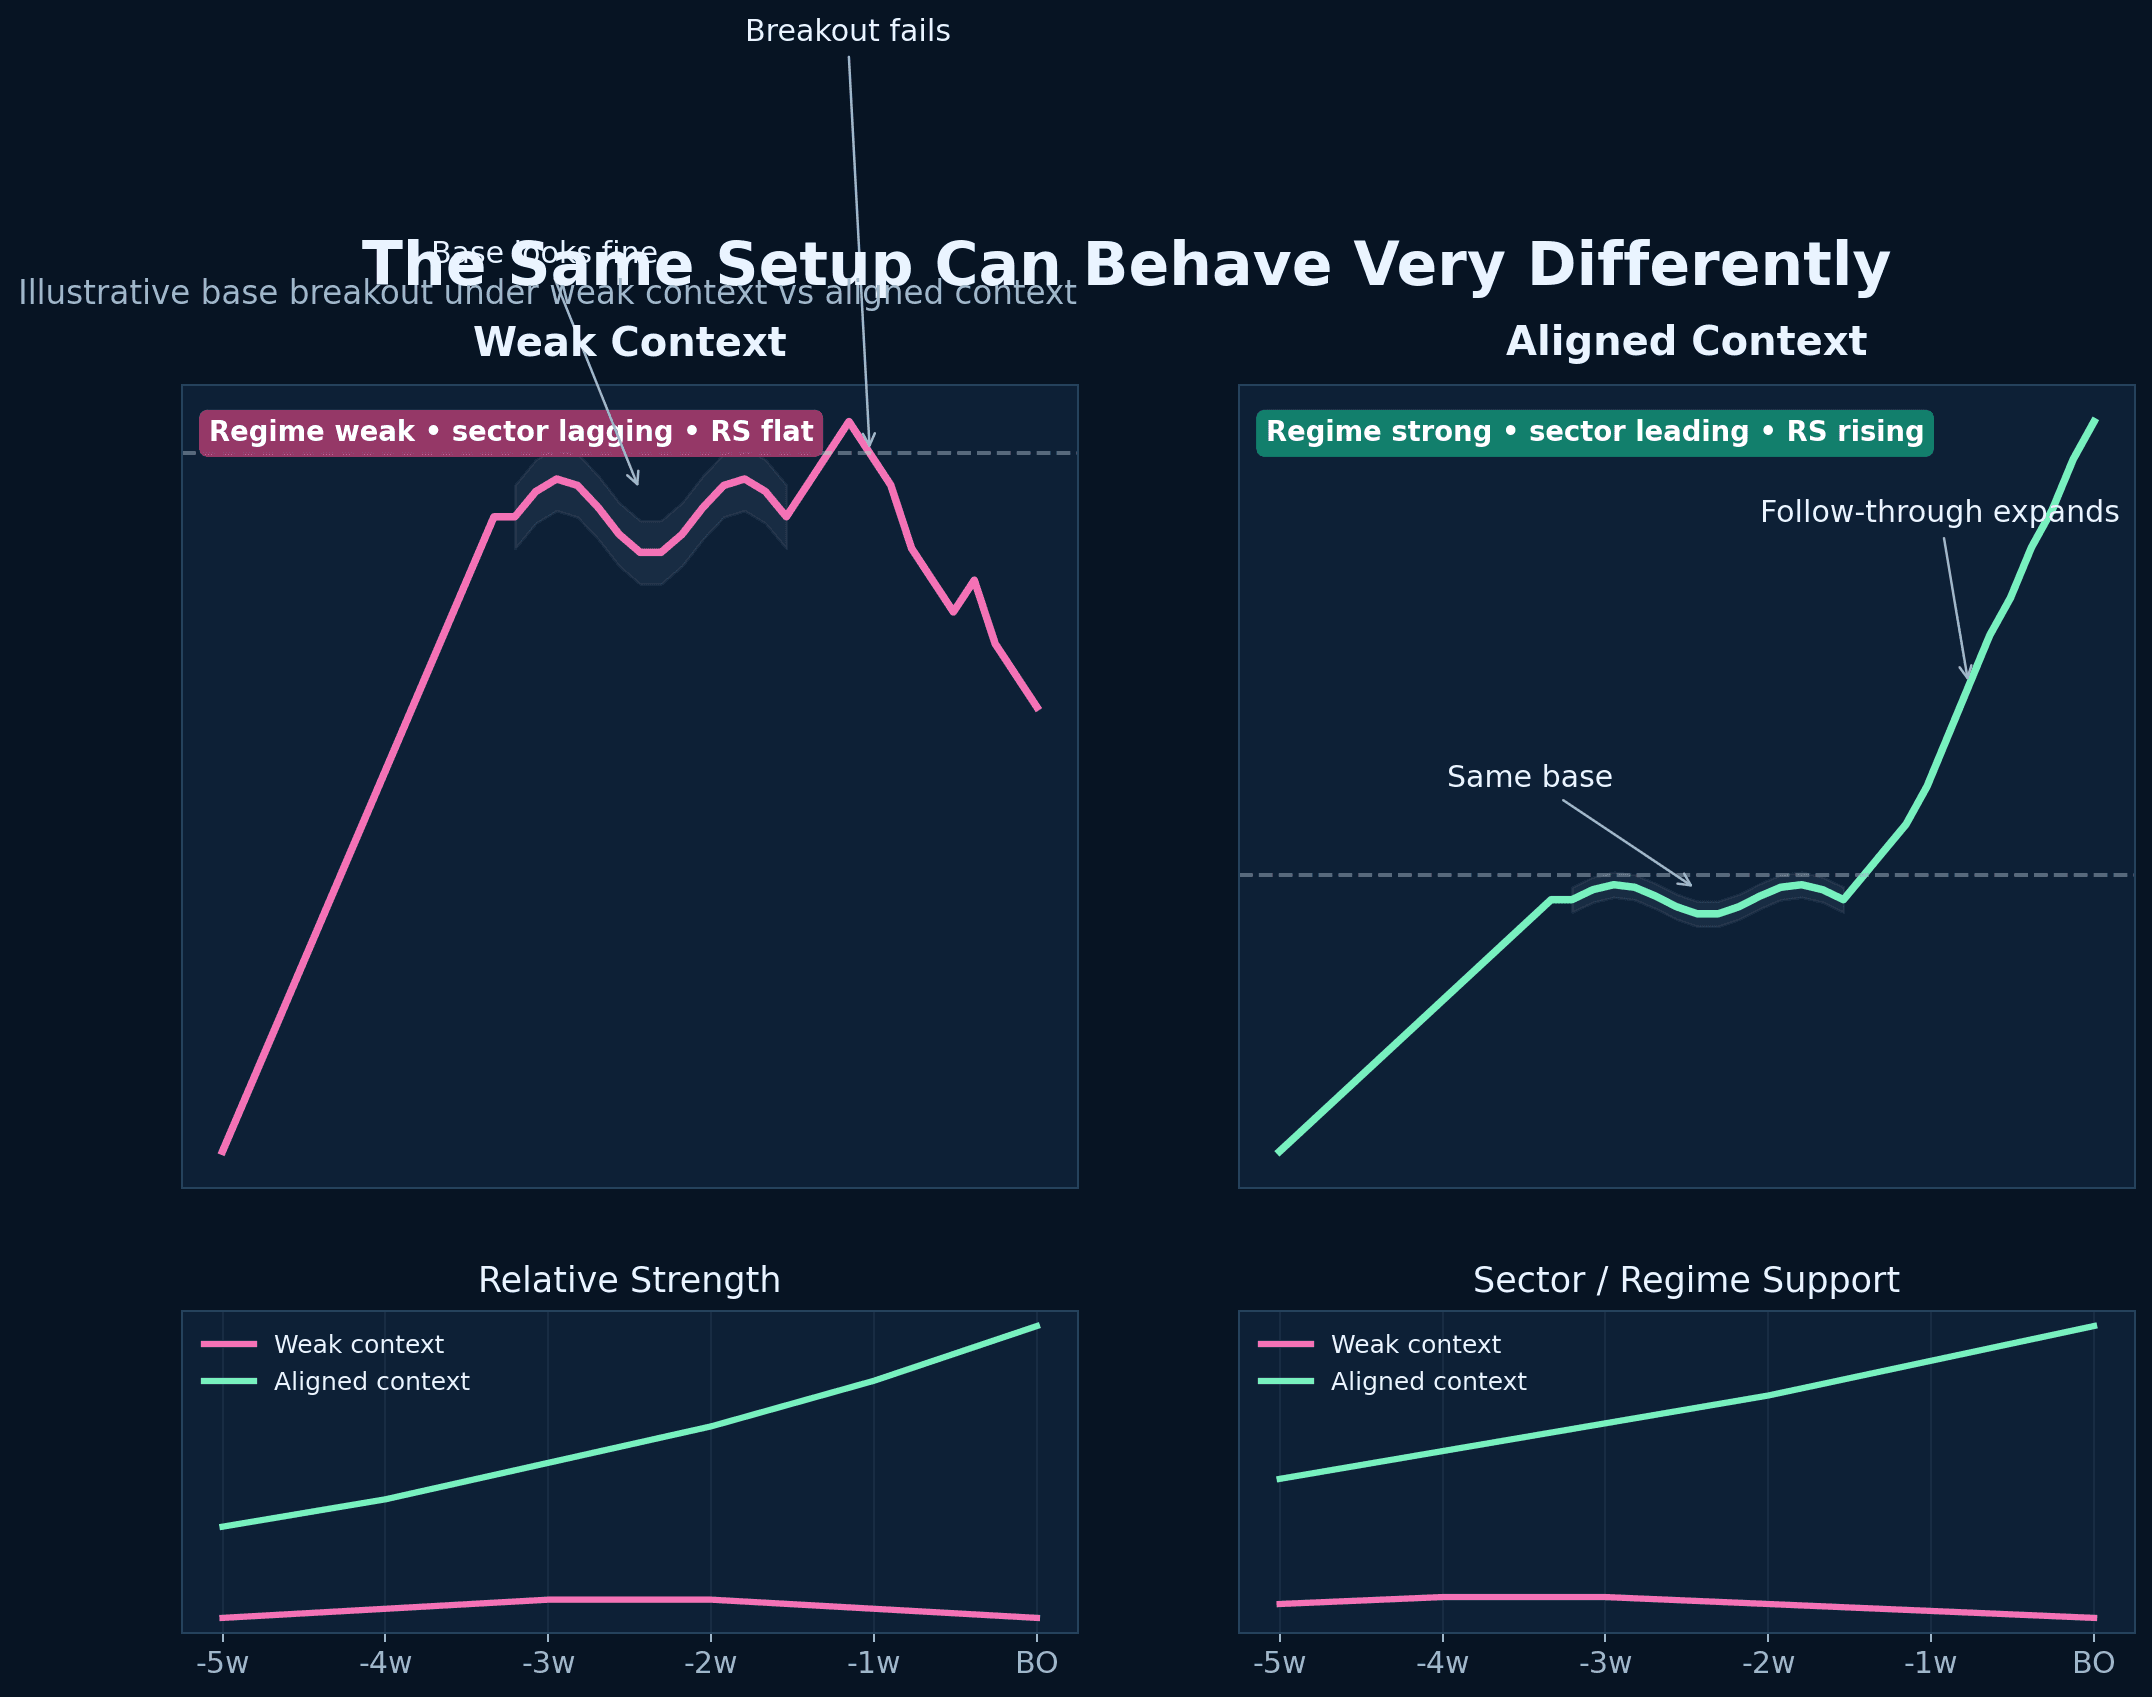
Consider a mid-cap stock building a tight, five-week consolidation base after a trending move. The price range during the base is narrow -- approximately 7 percent from low to high. Volume has been declining for three consecutive weeks. The structure is clean and readable. A breakout above the top of the base would trigger an entry by any reasonable technical standard.
Context A: The setup is weak
The broader Nifty 500 has been in a sideways, choppy regime for six weeks. There is no clear directional trend. The sector the stock belongs to -- consumer discretionary -- has a 6-month RS rank at the 44th percentile and has been flat to declining. The stock itself has a 3-month RS rank at the 51st percentile, showing no improvement during the consolidation.
Running this through the SLRA framework:
- Structure: A-grade. Tight base, volume contraction, clear trigger level.
- Location: Reasonable. Not perfect, but not fighting obvious overhead supply.
- Regime: Fails. Choppy market, no directional tailwind.
- Alignment: Fails. Sector RS is neutral to weak. Stock RS is not improving during the base.
Two of four conditions fail. The setup is technically valid but contextually weak. The probability of a sustained breakout is meaningfully lower than it appears from the chart alone. A disciplined trader watches this and waits. A pattern-focused trader enters and wonders why the breakout fades in two sessions.
Context B: The setup is strong
Same structure. Same stock. Same chart. But now the Nifty 500 has been in a confirmed uptrend for eight weeks. The sector -- capital goods -- has a 6-month RS rank at the 81st percentile and is showing accelerating 3-month RS. The stock's 3-month RS rank has climbed from the 68th to the 79th to the 88th percentile across three consecutive weekly reads during the consolidation phase.
Running through SLRA:
- Structure: A-grade. Same as before.
- Location: Reasonable. Same as before.
- Regime: Passes. Confirmed uptrend with broad participation.
- Alignment: Passes. Sector gaining RS. Stock RS expanding during the base -- the signature of institutional accumulation.
All four conditions pass. The setup is both technically valid and contextually supported. This is the version worth acting on. The structure did not change. The context did. That difference is the entire edge.
How to Combine Structure With Regime, RS, and Sector Context
In practice, this multi-layer evaluation does not require starting from scratch each week. It works most efficiently as a two-stage screening process.
Stage one: Context screening
Before looking at individual charts, establish the context layers. What is the current market regime? Which sectors are in the top quartile of RS? Which stocks are showing rising RS across 3-month and 6-month windows? This stage narrows the field from hundreds of possible candidates to a short list of names where context is already working in your favour.
The TradInvest features are built to surface this data without requiring you to rebuild the screening manually each week.
Stage two: Structure evaluation
Only after the context screen should individual charts be reviewed. At this stage, you are applying the SLRA framework to names that have already passed the context filter. You are looking for A-grade or B-grade structures in good locations, in stocks and sectors where regime and alignment are already confirmed.
This sequence -- context first, structure second -- is the reverse of how most traders work. Most traders find an interesting chart and then check whether the context supports it. The problem is that starting from the chart means your attention is already anchored to the setup, and confirmation bias makes it harder to disqualify it when context is weak.
Starting from context and moving to structure removes that anchor. You are building a shortlist based on where the evidence is strongest, then evaluating whether the price structure has reached a level where action makes sense.
For Indian Traders: Specific Considerations
Index mood drives intraday outcomes. In Indian markets, the broader Nifty direction on any given day has an outsized influence on whether individual stock setups resolve as expected. A technically valid breakout attempted on a day when Nifty is in a broad down move will face selling pressure that has nothing to do with the stock's specific setup. Regime context at the intraday level -- not just the weekly level -- matters for timing entries.
Expiry sessions change the rules. Weekly and monthly F&O expiry sessions in India create volatility and liquidity patterns that can invalidate setups that would work cleanly in normal sessions. Breakouts attempted during expiry tend to see more aggressive price reversals because options positioning creates temporary, non-directional supply and demand. For most swing setups, expiry day is not the right entry day regardless of how clean the structure looks.
Sector moves in India can be fast and policy-driven. Indian sector rotations often accelerate sharply around policy events -- Union Budget, PLI scheme announcements, infrastructure spending decisions, RBI rate changes. A stock in a sector that is about to receive a policy catalyst may show only modest RS improvement before the event and then gap sharply. Checking the event calendar alongside the SLRA evaluation reduces the risk of being caught on the wrong side of a policy-driven sector move.
Clean setups in low-liquidity names fail differently. In small-cap and micro-cap names on NSE, a tight base and expanding RS can look institutional but may simply reflect low-volume drift. The volume expansion signal on the breakout is less reliable in thinly traded names because it takes very little demand to move price. Applying the SLRA framework to names with sufficient average daily turnover that volume signals are meaningful is a practical constraint worth building in explicitly.
Side-by-Side: Structure-Only Evaluation vs Structure Plus Context
| Dimension | Structure Only | Structure Plus Context |
|---|---|---|
| Setup filter | Pattern recognition | Pattern plus regime, sector, RS, location |
| Input data | Individual chart | Chart plus sector RS, market regime, stock RS trend |
| False positive rate | Higher -- valid patterns in weak context | Lower -- patterns filtered by supporting context |
| Failure mode | Clean chart, failed follow-through | Occasionally misses early-stage emerging leaders |
| Best suited for | Experienced traders with strong regime intuition | Systematic traders building a repeatable process |
| Conviction basis | Pattern quality | Pattern quality plus four-layer context alignment |
| Typical error | Entering valid patterns in hostile environments | Waiting for context confirmation in fast-moving markets |
Common Mistakes
Treating all setups equally regardless of context. A B-grade structure in a top-quartile RS stock in a leading sector during a trending regime is a better trade than an A-grade structure in a lagging sector during a choppy market. Structure quality and context quality are both inputs to position conviction. Most traders only evaluate one.
Checking context after the chart has already captured attention. Confirmation bias is strongest when you have already found an interesting setup and are now looking for reasons to justify taking it. Reversing the sequence -- context screening before chart evaluation -- removes most of this bias.
Using regime as a binary filter. A deteriorating regime does not mean no trades. It means smaller size, higher structural standards, and preference for setups that work in range-bound conditions rather than pure trend-following setups. The regime assessment should adjust your approach, not shut it down entirely.
Ignoring location. Two setups with identical structure quality can have meaningfully different probabilities depending on whether there is room to run or significant overhead resistance immediately above the entry. Location is not a secondary consideration -- it directly determines the risk-reward ratio available at entry.
Failing to log which context conditions were present at entry. Without tracking regime, sector RS, and stock RS as part of your trade log, it is impossible to know whether underperformance is a structure problem or a context problem. The weekly review process requires this data to produce meaningful analysis.
Pre-Trade Context and Structure Checklist
Before entering any trade, run through this sequence. It takes two to three minutes once the habit is established.
Market regime check
- Is the Nifty in a trending, range-bound, or deteriorating phase this week?
- Is today an expiry session, event day, or normal session?
- Is the regime context supportive of this type of setup?
Sector context check
- What sector is this stock in?
- Is the sector in the top half of RS rankings on a 6-month basis?
- Is the sector RS improving or deteriorating in recent weeks?
Stock RS check
- Has the stock's RS percentile rank been rising during the consolidation?
- Is the stock in the top half of its universe on both 3-month and 6-month RS?
- Is the RS behaviour consistent with accumulation or with drift?
Structure check
- Is this an A-grade or B-grade setup?
- Is the entry location clean with room to the next resistance?
- Is there a clearly defined entry trigger and invalidation level?
Execution risk check
- Are there any near-term events that could create non-directional volatility?
- Is today's session type appropriate for this kind of entry?
If the majority of these questions produce clear, supportive answers, the trade merits consideration. If multiple questions produce weak or uncertain answers, the setup stays on the watch list.
Key Takeaway
Price structure tells you whether a stock is positioned to move. Market context tells you whether the environment will allow it. Neither is sufficient without the other.
The SLRA framework -- Structure, Location, Regime, Alignment -- is a four-question sequence that evaluates both dimensions before any trade is taken. Running structure-only setups through all four questions takes two to three minutes and removes most of the context-related failures that produce technically valid entries with disappointing outcomes.
The practical habit is the sequence: screen for context first, then evaluate structure within the shortlist that passes the context filter. This is the reverse of how most retail traders work, and the reversal is where most of the edge lies.
For Indian traders specifically, regime awareness at the intraday level, sector RS tracking across Nifty sectoral indices, and explicit avoidance of expiry-session entries for swing setups are the three context adjustments that make the most difference relative to a structure-only approach.
The TradInvest content cluster -- market regime, sector rotation, pre-breakout selection, weekly review, and trade journaling -- works best as a connected system. This article is the integration point where those pieces come together in the moment before a trade is taken.
If you want the workflow support behind that process, TradInvest's screening and analytics features surface the context-layer data -- sector RS, stock RS ranking, and regime signals -- so the pre-trade checklist can be run quickly rather than rebuilt from scratch each session. The Edge section shows how that fits into a live decision workflow, and the pricing page covers the full toolkit.
Spread the good words
Give your view.
Give your view
Comments
0Use this insight inside the product
TradInvest is built to connect market context, strategy quality, and post-trade learning. Read the market with Pulse, narrow your watchlist with rotation and momentum, then review what actually worked.
Related posts
More insight tied to the same trading workflow.

