
Every trader who has bought a breakout knows the specific frustration of a false one.
The stock clears the level. You enter. It holds for a session, maybe two. Then it reverses hard back inside the range, stops you out, and proceeds to do nothing for three more weeks. The setup looked right. The entry was technically valid. And yet the trade failed in a way that felt like the market knew exactly where your stop was.
How to avoid false breakouts is one of the most searched questions in trading education for a reason. The pattern is universal. And the standard answer -- wait for volume confirmation, make sure the breakout closes above the level -- is not wrong exactly, but it is incomplete in a way that keeps traders getting stopped out of the same setups repeatedly.
The real problem with false breakouts is not the breakout itself. It is the conditions surrounding it. A breakout is a price event. Whether it holds depends on whether the forces behind it -- institutional demand, sector momentum, broader market direction -- are substantial enough to sustain the move against the selling that always follows a visible level break.
This article explains how to read those forces before entry, not after the trade has already failed.
What a False Breakout Actually Is
A false breakout is a price move beyond a defined level -- a resistance zone, a consolidation boundary, a prior high -- that fails to attract enough follow-through demand to sustain itself above that level, reverting back inside the range within one to several sessions.
It is not random. It has specific causes, most of which are visible in the data before the breakout occurs.
The mechanics are straightforward. Every significant resistance level accumulates supply -- traders who bought lower and are waiting to exit at a profit, short sellers who established positions at that level expecting it to hold, and systematic players who have stop orders set just beyond the level. When price reaches that zone, all of that supply becomes active. For a breakout to succeed, demand has to be strong enough to absorb that supply and continue higher.
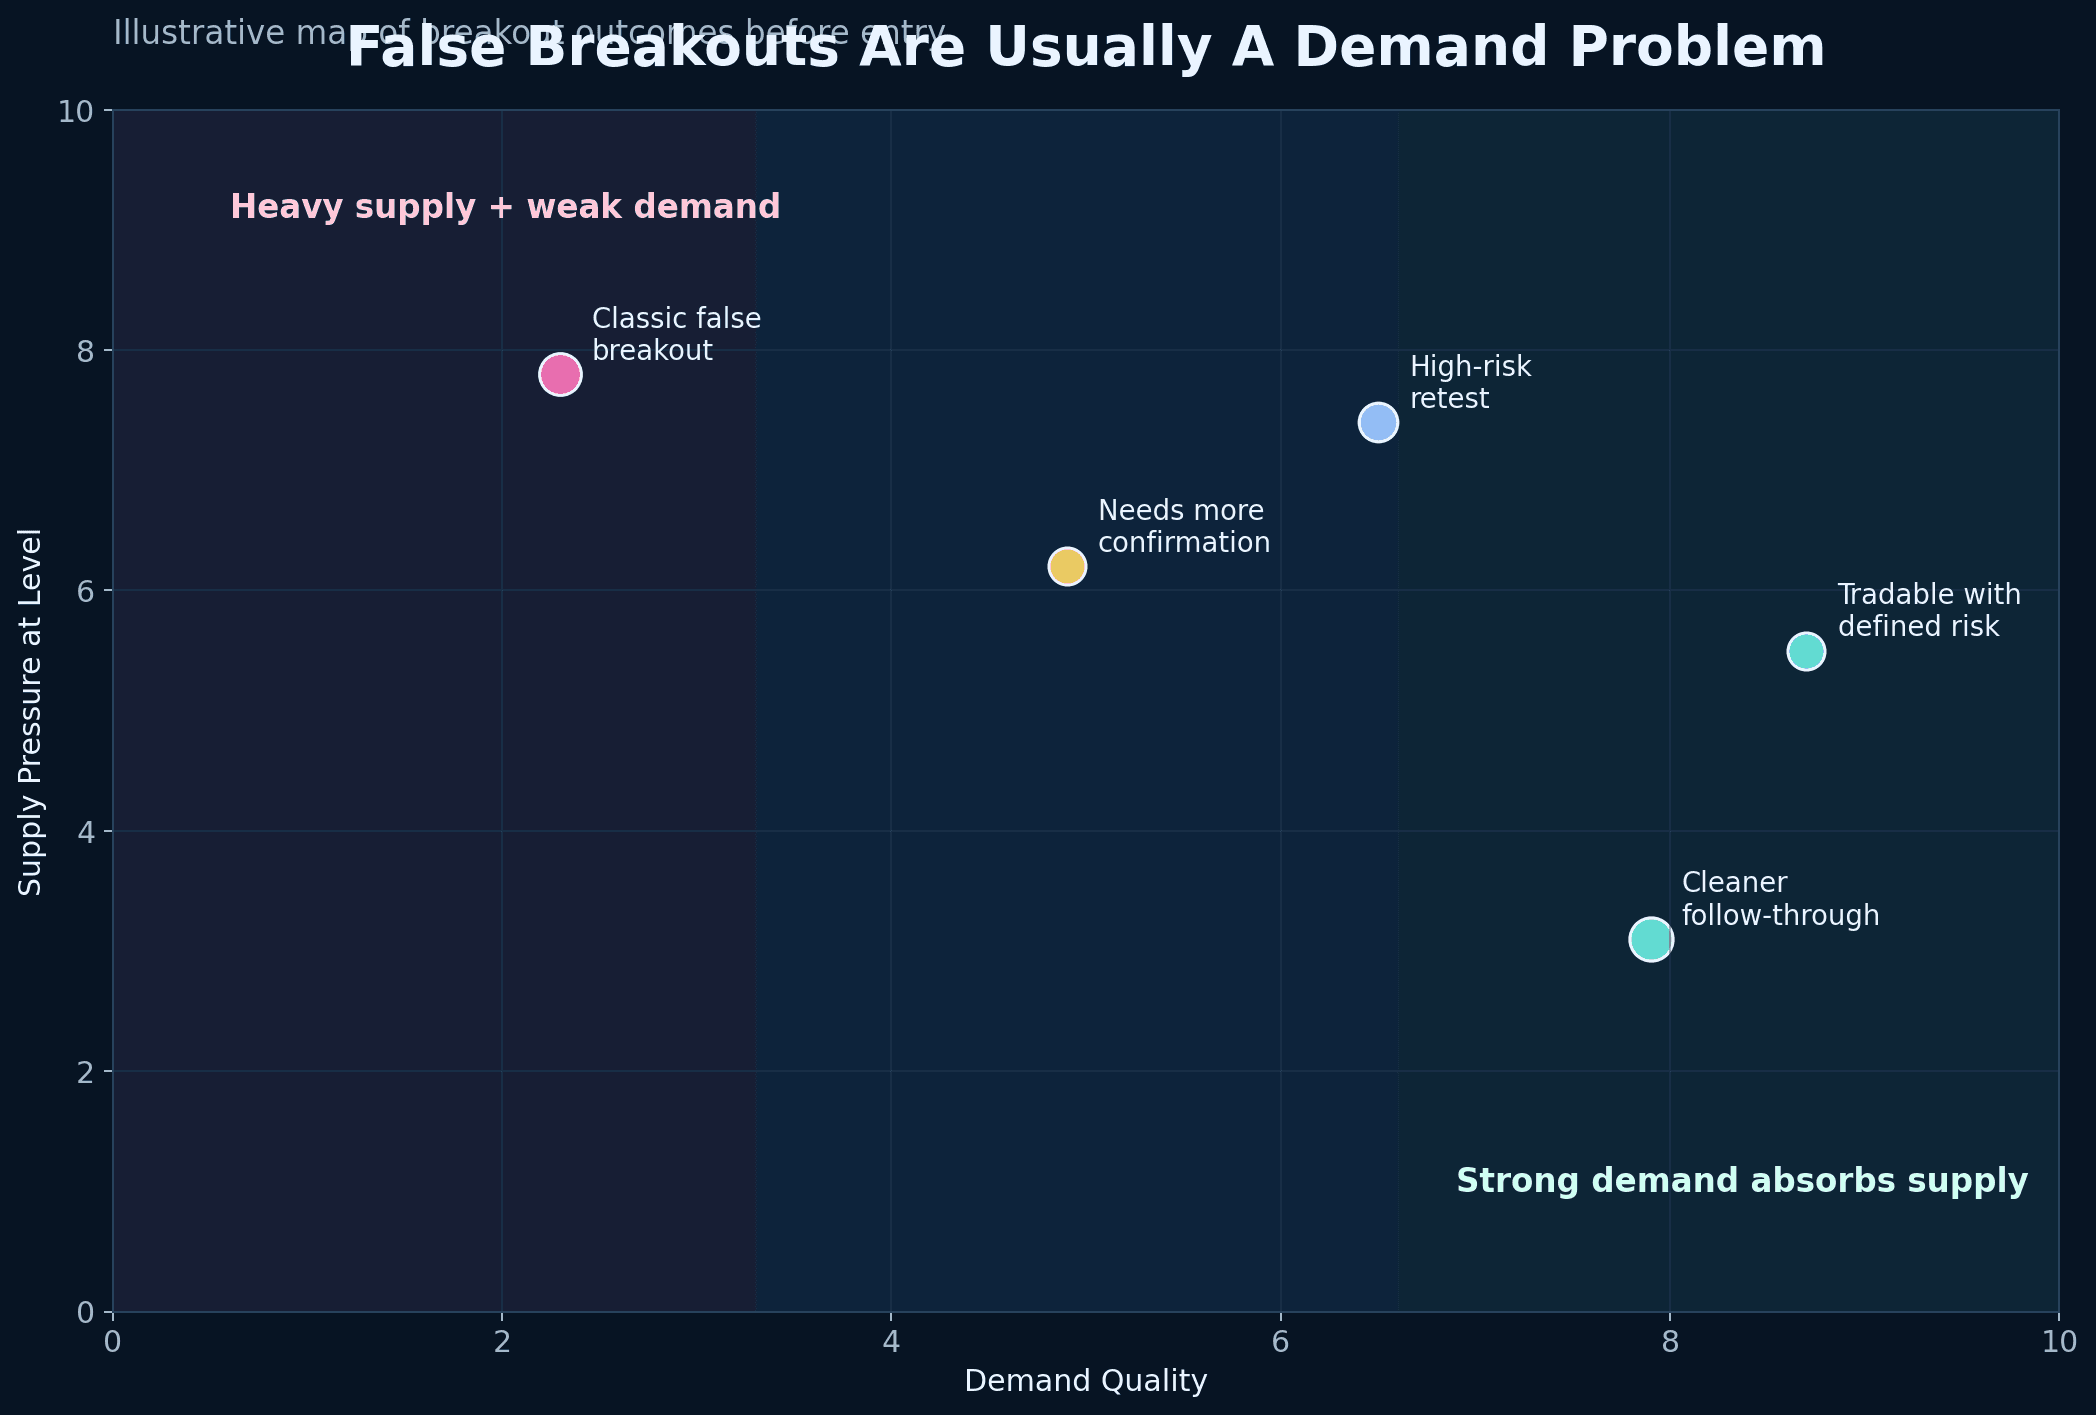
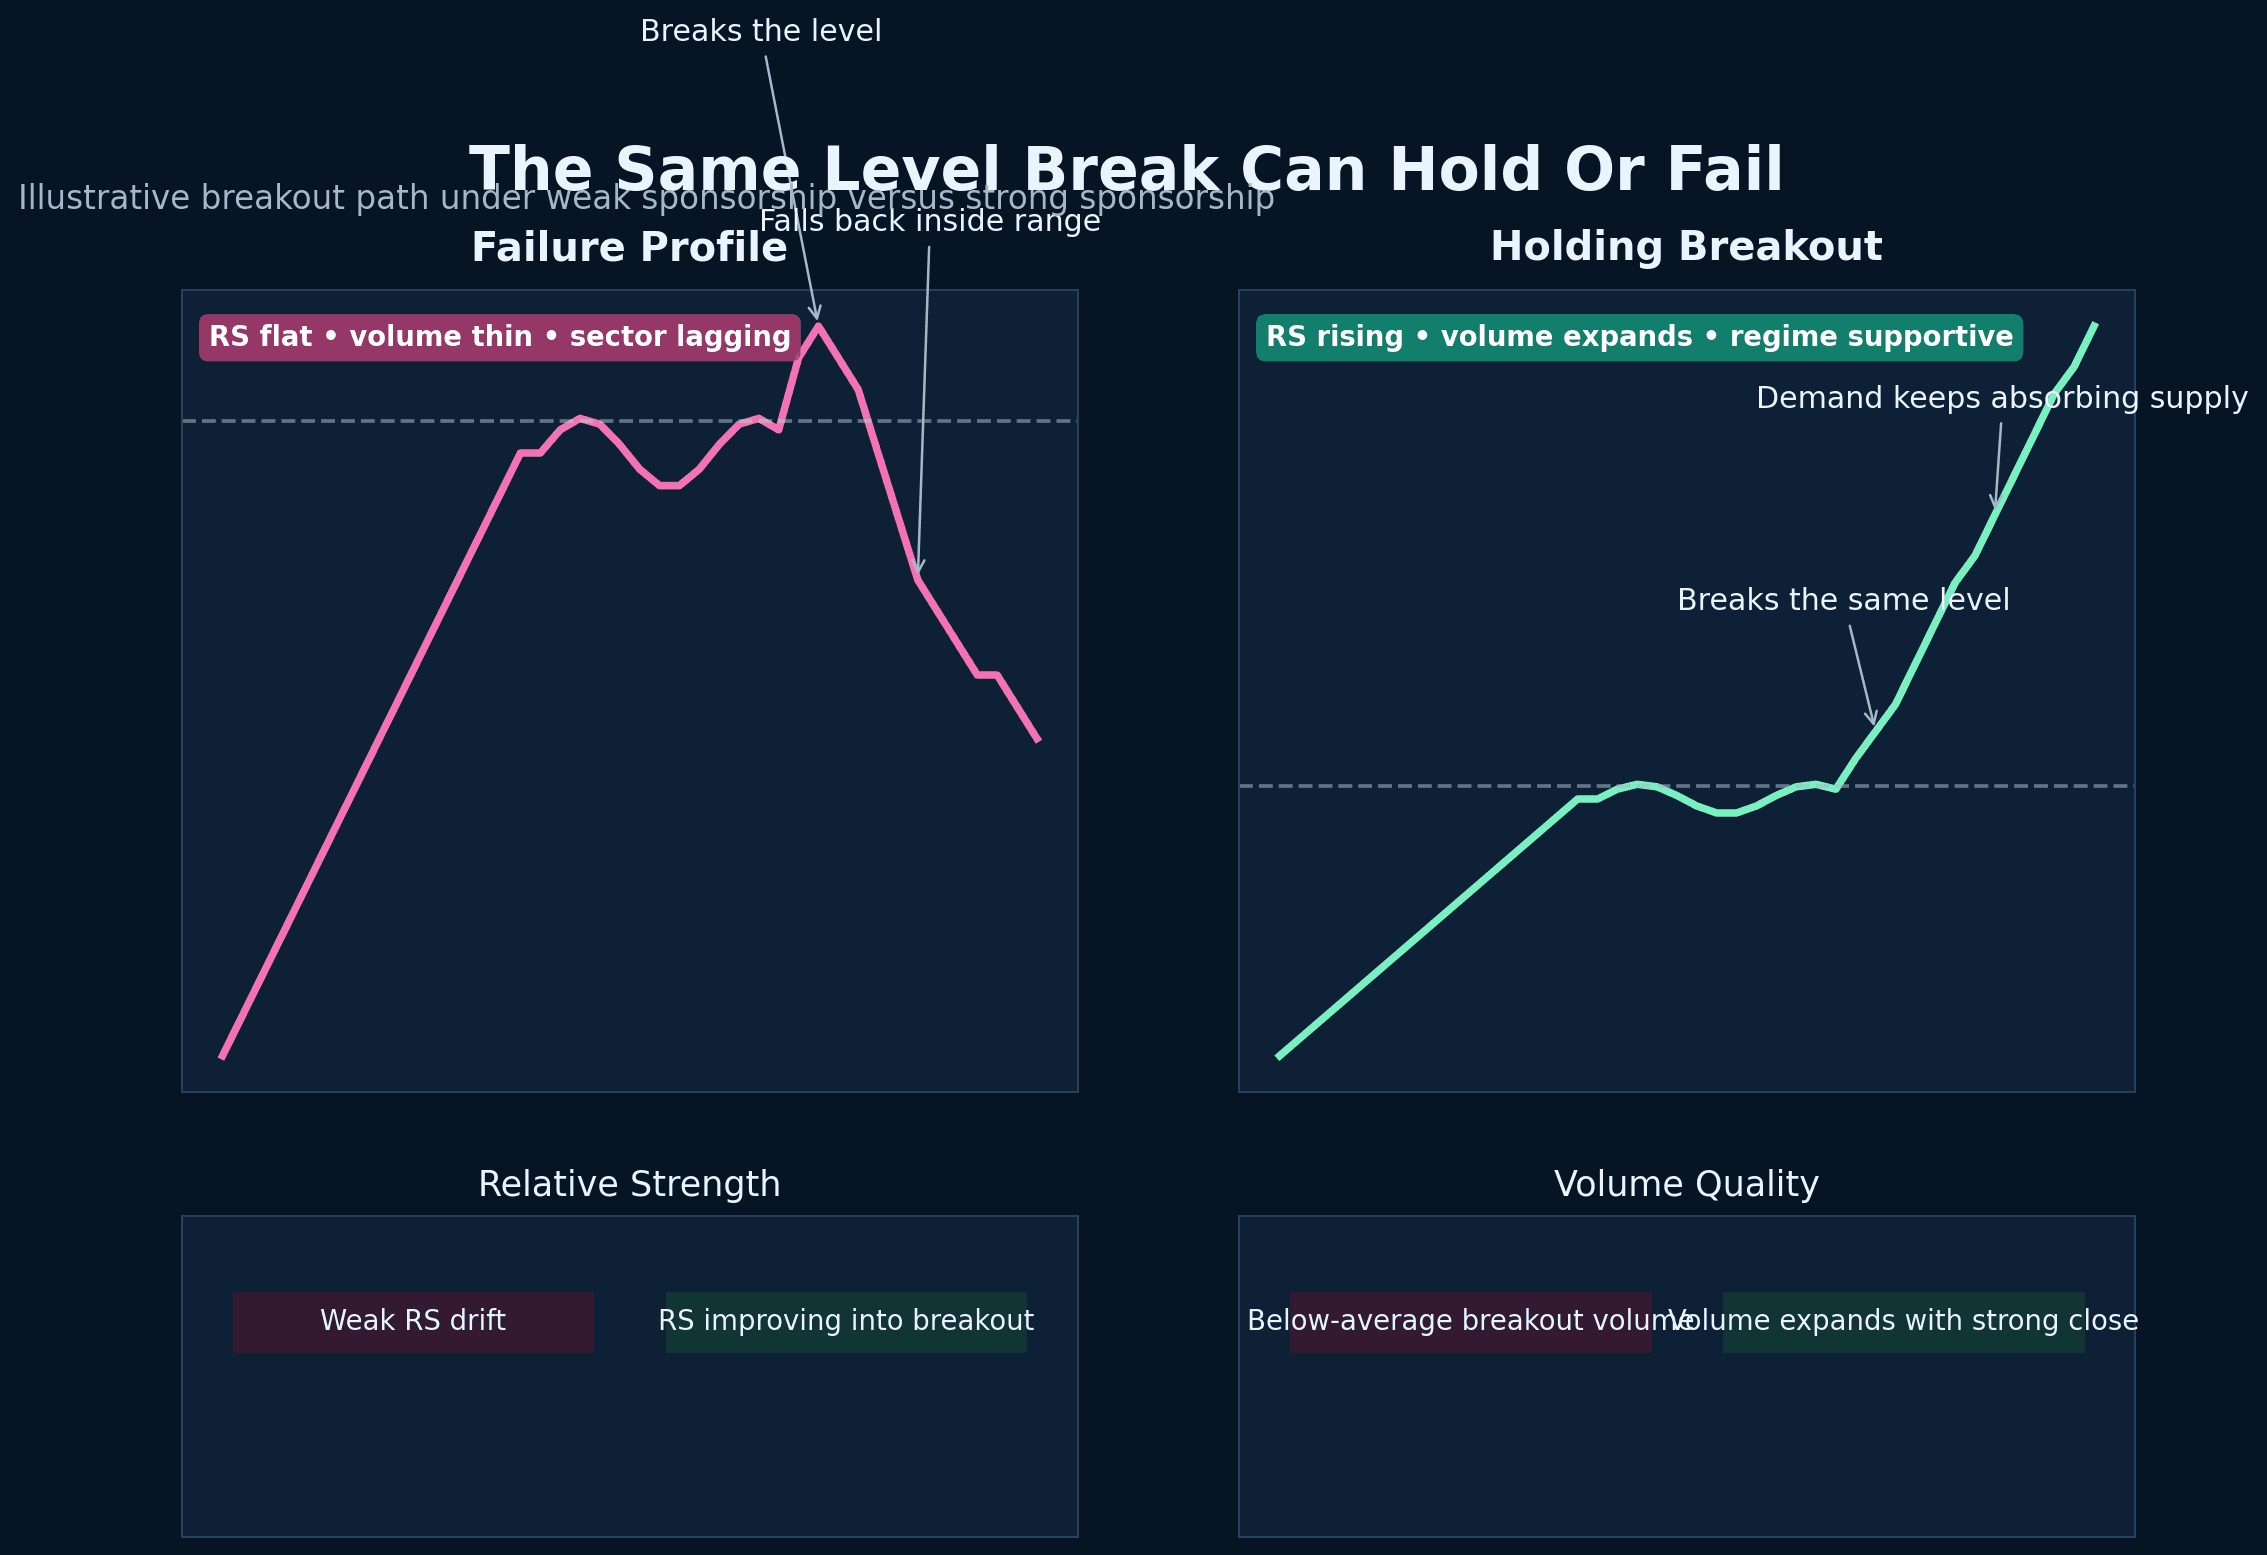
When demand is strong -- when institutional buyers are behind the move, when sector flows are supportive, when relative strength has been building during the consolidation -- supply gets absorbed and the breakout holds. When demand is thin -- when the move is driven by pattern recognition alone, retail momentum, or event-driven noise -- the supply at the level overwhelms the incoming buyers and price reverses.
Understanding false breakouts is therefore understanding demand quality. The chart level is the same in both cases. What differs is what is behind the move.
Why Price Alone Is Not Enough to Filter Breakouts
The most common version of breakout trading works like this: a stock crosses a key level, the trader enters, and the stop is set just below the level. The logic is clean. The execution is simple. And it fails at a rate that makes it unprofitable as a standalone approach in most market conditions.
The reason is that a price crossing a level is visible to every trader running a scanner. The moment a widely watched level breaks, a wave of momentum-driven retail buying arrives -- and that buying often exhausts itself within one to three sessions as early buyers take profits and the supply from the original resistance zone reasserts itself.
Real breakouts that sustain are not driven by scanner-triggered retail momentum. They are driven by institutional demand that was building during the consolidation, that accumulated stock quietly at levels below the breakout point, and that continues buying as price moves higher because the thesis behind the position has not changed.
The difference between a retail-driven breakout and an institution-supported breakout is not visible on the price chart at the moment of the breakout. It is visible in the behaviour of the stock in the weeks leading up to it -- in the relative strength trend, in the volume pattern during the base, and in the sector and regime context surrounding it.
That is what the pre-breakout selection framework addresses: finding the evidence of real demand before the breakout becomes obvious. This article is the companion -- identifying when that evidence is absent, so the breakout can be avoided before the stop is hit.
Warning Signs Before a Breakout Fails
Most false breakouts telegraph themselves before they happen. The warning signs are visible in the data. Traders who are not looking for them take the trade anyway and then explain the loss as bad luck.
Declining relative strength during the base. A stock approaching a key resistance level with flat or declining RS is telling you something important: it is losing ground against the rest of the market even before the breakout. That is not a stock with institutional accumulation behind it. That is a stock drifting toward a visible level because nothing else is happening. When this stock hits resistance, there is no built-up demand to power through the supply. The level holds, price reverses. For a full breakdown of how RS should behave before a genuine breakout, the relative strength guide covers the foundation.
Volume that does not expand on the breakout. A breakout on below-average volume is the single most reliable warning sign that the move lacks conviction. Volume expansion on a breakout confirms that new buyers are arriving at the level in sufficient size to overwhelm sellers. When volume stays muted -- even if price clears the level cleanly on the chart -- it means the crossing happened on thin demand. A thin-demand breakout reverses at the first sign of profit-taking.
Weak or lagging sector context. A stock breaking out while its sector is in the bottom half of RS rankings is fighting a structural headwind. Sector flows shape individual stock outcomes. A breakout in a sector that is losing institutional capital has a lower probability of sustained follow-through because the macro environment is working against the individual story. The sector rotation article covers how to read this in real time.
Hostile market regime. Breakouts attempted in range-bound or deteriorating market regimes fail at higher rates than the same setups in trending regimes. In a choppy market, the index-level absence of a directional bid means individual stocks face more aggressive selling on any advance. For the framework on reading regime, see the market regime article.
Obvious levels with heavy prior history. The more obvious a resistance level is -- the more times price has tested it, the more widely it is discussed -- the more supply has accumulated there. A level that has been tested four or five times and held becomes a self-fulfilling trap: it attracts breakout buyers precisely because it is well-known, and it fails precisely because the supply at that level is substantial and patient.
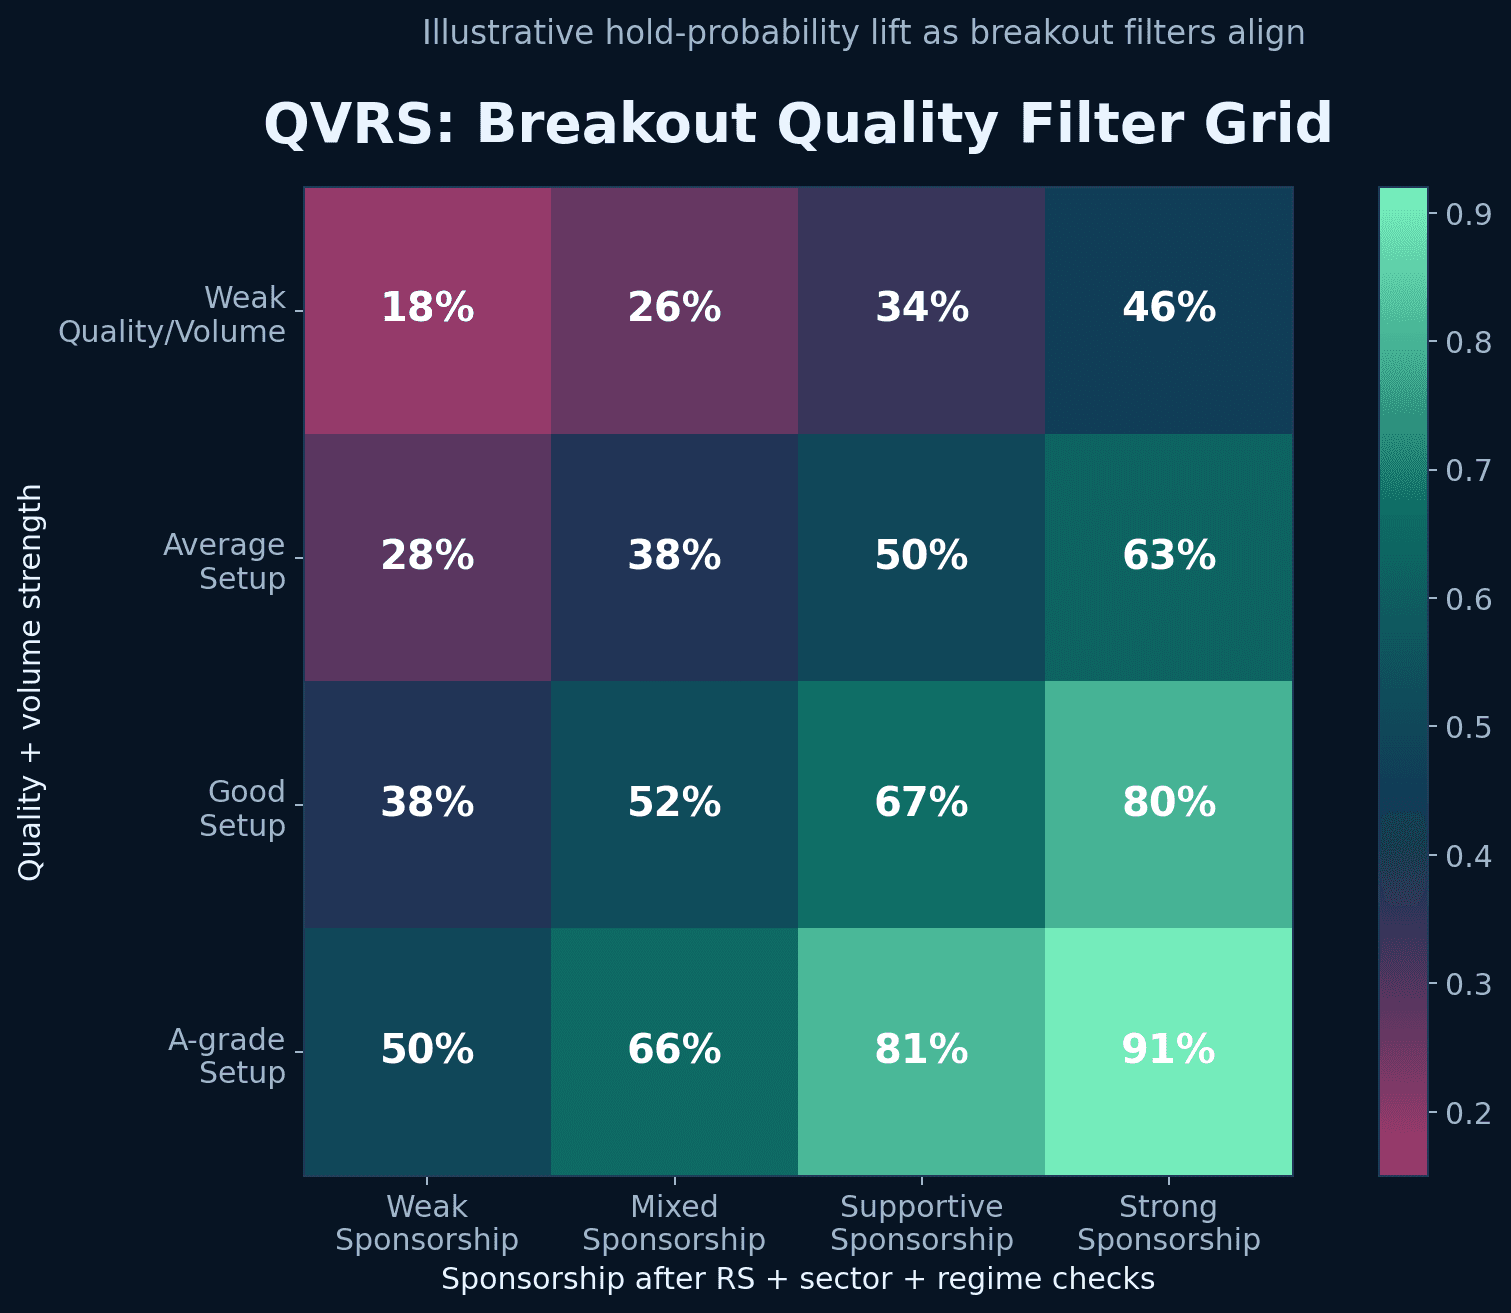
The QVRS Framework: Four Filters Before Any Breakout Entry
Filtering false breakouts requires evaluating four conditions before entry. The QVRS framework -- Quality, Volume, Relative Strength, Sponsorship -- applies these four filters in sequence. A breakout that fails any one of them is a breakout that should either be passed or sized significantly smaller.
Q -- Quality (Is the breakout level genuine and clean?)
Not all resistance levels are equal. A quality breakout level is one where price has tested the zone two to three times across different timeframes, where the prior consolidation base is tight and well-formed, and where there is meaningful room above the level before the next significant resistance zone. A level that has been tested six or seven times over many months has too much accumulated supply to be a clean breakout candidate. A level that is ambiguous enough that different traders would draw it differently is not a quality level.
Quality also means structure quality during the base. Was the consolidation tight and controlled, or wide and chaotic? Tight, controlled bases with clear boundaries produce cleaner breakouts because the sellers who wanted out have already exited at lower prices. Chaotic consolidations mean contested supply is still present at the breakout level.
V -- Volume (Does the breakout have sufficient demand behind it?)
Volume on the breakout session should be meaningfully above the average volume during the consolidation phase. Ideally, the breakout session is one of the highest-volume sessions the stock has seen in several weeks. This expansion confirms that new buyers -- not just early holders who bought the base -- are arriving at the breakout level in size.
Volume should also be considered directionally. Strong volume on the upside breakout session combined with a close near the high of that session is a better confirmation than volume spread across an indecisive candle that closes mid-range. The closing location on high volume matters.
R -- Relative Strength (Was RS improving during the consolidation?)
The RS check is the most important forward-looking filter. A stock whose RS percentile rank was climbing during the weeks of consolidation -- quietly outperforming the broader market while price went nowhere obvious -- has institutional demand behind it. That demand does not disappear on the breakout day. It continues buying, absorbing the supply at the resistance level.
A stock with flat or declining RS during the base has no such demand behind it. The breakout is price-driven, not demand-driven. The distinction is entirely visible in the weekly RS data before the breakout occurs. Multi-timeframe RS analysis as covered in the price structure and context article applies here directly.
S -- Sponsorship (Is the sector and regime context supportive?)
Sponsorship is the broader support structure behind an individual breakout. It has two components.
Sector sponsorship: is the sector gaining RS simultaneously? A breakout in a stock inside a sector that is itself breaking out to new RS highs has the strongest possible sponsorship. Capital flows are moving toward the sector and lifting individual names. A breakout in a lagging sector has no sector sponsorship -- it is an isolated move against the prevailing capital flow direction.
Regime sponsorship: is the broader market in a trending phase where breakouts from strong bases tend to hold? Or is the market choppy and range-bound, where every advance tends to be sold? Regime determines the probability that any given breakout will follow through, regardless of how well the individual stock scores on the other three filters.
When all four QVRS conditions pass, the breakout has strong evidence behind it. When one or more fail, the probability of a false breakout increases proportionally.
Worked Example: A Breakout That Had Quality But Failed the Rest
Consider a large-cap IT sector stock on NSE. The stock has been consolidating for six weeks in a range that is approximately 8 percent wide. The consolidation looks clean on a price chart -- tight range, well-defined boundaries, a clear resistance level at the top. By structure alone, it is a readable breakout candidate.
The QVRS evaluation:
Quality: Passes. The consolidation is tight and the resistance level is clean -- tested twice over the prior three months, with price closing below it consistently. There is room above the level before the next major supply zone. Structure quality is solid.
Volume: Marginal. On the breakout day, volume comes in at approximately 1.1 times the average volume during the consolidation. It is slightly above average but not the meaningful expansion that confirms broad new demand. The close is in the middle of the session's range -- not a weak close, but not a convincing one either.
Relative Strength: Fails. The stock's 3-month RS percentile rank during the consolidation moved from the 62nd to the 58th to the 53rd percentile across three consecutive weekly reads. While price was going nowhere obvious, the stock was losing ground against the broader Nifty 500 universe. No institutional accumulation signature. The RS was drifting lower, not building.
Sponsorship: Fails. The Nifty IT sector has a 6-month RS rank at the 39th percentile -- clearly in the lagging half of the market. The broader Nifty 500 has been in a choppy, directionless phase for five weeks with no clear trending regime established.
The outcome:
The breakout clears the level and holds for one session. Volume on day two is below average. On day three, the broader Nifty has a weak session and the IT sector sells off. The stock reverses back below the breakout level and returns to the middle of its prior consolidation range within the week. Traders who entered on the breakout are stopped out.
What the QVRS framework showed before entry:
Quality passed -- the setup looked valid on structure. But Volume was marginal, RS was deteriorating, and Sponsorship from both the sector and the regime was absent. Three of four filters produced weak or failing signals. The evidence against the trade was available before entry. The loss was avoidable.
For Indian Traders: False Breakout Traps to Know
Expiry day opening spikes. In Indian markets, weekly and monthly F&O expiry sessions frequently produce sharp opening moves that clear prior resistance levels intraday -- only to reverse completely before the session ends. These are not genuine breakouts. They are driven by options-related buying and short covering at expiry, not by durable demand. A stock that breaks out only during an expiry session and cannot sustain the level into the next regular session has demonstrated the move was mechanically driven, not demand-driven. Applying QVRS to expiry-day breakouts almost always reveals missing volume quality and absent RS support.
Event-driven gap openings. Results days, budget mornings, and RBI policy announcements produce gap openings that clear resistance levels instantaneously. These moves bypass the normal breakout process entirely -- there is no volume building at the level, no RS confirmation period, no base quality assessment available. Trading these as breakout entries without waiting to see how the stock trades in the hours following the event is not breakout trading -- it is event speculation. Most event-gap entries that are not supported by exceptional RS and sector context fail when the event impact fades within a few sessions.
Low-float and low-liquidity names. In small-cap and micro-cap names on NSE, a stock can clear a resistance level on very low absolute volume simply because the float is small enough that it does not take many buyers to move price. The volume filter in QVRS is designed for names with sufficient average daily turnover that volume changes are meaningful. In thinly traded names, price can move to any level on thin demand with no institutional participation whatsoever. These are the most dangerous false breakout environments.
Sector-driven fakeouts in Indian mid-caps. Indian mid-cap sectors can run hard on policy-related news -- PLI schemes, infrastructure announcements, energy sector developments -- and then retrace just as aggressively when the policy narrative fails to produce immediate earnings follow-through. A mid-cap stock breaking out in a sector that is rising on speculative policy optimism, without underlying RS confirmation across multiple weeks, is a fakeout candidate. The sector RS needs to be genuine and sustained, not event-driven and episodic.
Side-by-Side: High-Probability Breakout vs False Breakout Profile
| Filter | High-Probability Breakout | False Breakout Profile |
|---|---|---|
| Base structure | Tight, controlled, clear boundaries | Wide, choppy, ambiguous level |
| Breakout volume | Meaningfully above consolidation average | At or below consolidation average |
| RS during base | Rising across 3-month and 6-month windows | Flat or declining during consolidation |
| Sector RS | Top half or gaining in rankings | Bottom half or deteriorating |
| Market regime | Trending, supportive of breakouts | Choppy, range-bound, or deteriorating |
| Breakout session close | Near the high, strong close | Mid-range or near the low |
| Prior level tests | Two to three tests maximum | Four or more tests, heavy supply |
Common Mistakes in Breakout Trading
Entering immediately on the price cross. The first session a level is crossed is often the most dangerous entry point. Early buyers who positioned inside the base are taking profits. Supply at the level is heaviest immediately at the cross. Waiting to see how the stock behaves in the sessions following the breakout -- whether it holds above the level, whether volume stays elevated, whether it builds a new smaller base just above the prior resistance -- filters a significant proportion of false breakouts without requiring any additional indicators.
Using volume as the only filter. Volume confirmation is necessary but not sufficient. High-volume breakouts in lagging sectors during choppy regimes still fail regularly. Volume tells you demand arrived. RS, sector, and regime tell you whether that demand is durable.
Treating all resistance levels as equivalent. A level that has been tested six times over eighteen months has a fundamentally different supply profile than a level that has been tested twice over four weeks. The more widely watched a level is, the more supply is waiting there, and the more demand is required to clear it sustainably. The quality of the level is as important as the quality of the structure.
Ignoring what the stock is doing relative to its sector. A stock breaking out while its sector is simultaneously selling off is an extremely low-probability trade. Sector-level weakness creates selling pressure that is entirely independent of the individual stock's chart. Stock-level analysis without sector context misses this entirely.
Taking every QVRS-qualified breakout at full size. Even when all four filters pass, breakouts carry inherent uncertainty. The appropriate response to a high-QVRS breakout is a defined initial position with a clear invalidation level, not maximum size from the first session. Scaling into strength after the breakout holds is lower risk than full commitment on day one.
False Breakout Filter Checklist
Before entering any breakout, run through this sequence. The full check takes two to three minutes once the habit is established.
Level quality check
- Has this level been tested two to three times, not more?
- Is the consolidation base tight with clear boundaries?
- Is there sufficient room above the level before the next resistance zone?
Volume check
- Is breakout volume meaningfully above the consolidation average?
- Does the session close near the high of the day?
- Has volume been declining during the consolidation base (a positive sign)?
Relative strength check
- Has the stock's 3-month RS percentile rank been improving during the consolidation?
- Is the stock in the top half of its universe on 6-month RS?
- Is the RS behaviour consistent with accumulation or with drift?
Sector and regime check
- Is the stock's sector in the top half of RS rankings?
- Is the sector gaining RS, not losing it?
- Is the broader market in a trending regime supportive of breakout follow-through?
- Is today a normal session, not an expiry or major event day?
Timing and execution check
- Are there any near-term events that could create non-directional volatility?
- Is the breakout occurring at a logical time in the session, not in the opening spike?
- Is the invalidation level clearly defined before entry?
If the majority of these items produce clear, supportive answers, the breakout merits consideration with defined risk. If multiple items produce weak or uncertain answers, the setup stays on the watch list.
Key Takeaway
A false breakout is not bad luck. It is a predictable outcome when demand quality is insufficient to absorb the supply waiting at visible resistance levels.
The QVRS framework -- Quality, Volume, Relative Strength, Sponsorship -- evaluates the four conditions that determine whether a breakout has real demand behind it before entry. A breakout that passes all four filters has multiple confirming forces behind it. A breakout that fails one or more filters has identifiable weaknesses that make failure significantly more probable.
The practical application is sequential: check Quality and Volume on the chart, then check Relative Strength in the weekly RS data, then check Sponsorship from sector RS and market regime. A breakout that clears all four is worth taking. One that fails two or more should be watched, not bought.
For Indian traders specifically, expiry sessions, event-driven gap openings, and sector-driven mid-cap fakeouts are the three environments where applying QVRS most aggressively -- and requiring higher standards on every filter -- pays for itself quickly.
The full TradInvest breakout and selection cluster -- pre-breakout identification, price structure and market context, sector rotation, and market regime -- works best as a connected system. This article is the defensive layer inside that system: keeping you out of trades that look right but are not well sponsored.
If you want the workflow support behind that process, TradInvest features surface RS tracking, sector RS data, and regime context so the QVRS filters can be checked quickly instead of rebuilt manually each session. The Edge section shows how those filters fit into a live screening workflow, and the pricing page covers the full toolkit.
Spread the good words
Give your view.
Give your view
Comments
0Use this insight inside the product
TradInvest is built to connect market context, strategy quality, and post-trade learning. Read the market with Pulse, narrow your watchlist with rotation and momentum, then review what actually worked.
Related posts
More insight tied to the same trading workflow.


